
Navajo DNA
Genetic origins and closest populations · United States · Americas
The Navajo, or Diné, live on the largest reservation in the United States, the Navajo Nation. Their language belongs to the Athabaskan branch of the Na-Dene family, whose other members are spoken mainly in Alaska and western Canada, and Navajo Code Talkers used it in the Second World War. Athabaskan speakers reached the Southwest from the north shortly before European contact, and the genetic profile keeps a northern signature: in our model, the Navajo average is 77.8% Native American (Paleo-American), with 13.8% Ancient Northeast Asian, 5.2% Ancient North Eurasian and 3.1% Arctic Siberian. Genetic studies link this extra northern Asian-related ancestry, about a fifth here, with a later stream from Siberia found in Na-Dene speakers. The closest modern averages are the Oji-Cree, the Crow and the neighbouring Hopi (around 0.028), and the closest ancient individual is the Kennewick burial from Washington State, known to Plateau tribes as the Ancient One (0.0375).
- Largest ancient components in our model: Native American (Paleo-American) 77.8%, Ancient Northeast Asians 13.8%, Ancient North Eurasians 5.2%
- Closest modern population in our data: Oji-Cree, distance 0.0272
- Closest ancient group in our data: USA Washington Paleo-Indian Kennewick, distance 0.0375
This page sums up what the DNA of the Navajo sample tells us about deep origins. It is built from the averaged Global25 (G25) coordinates of individuals sampled in United States, and it is one of 335 populations in our atlas. An average describes the group as a whole, not any single person in it.
Ancient make-up of the Navajo average
The ancient make-up of the Navajo average is led by Native American (Paleo-American) (77.8%), followed by Ancient Northeast Asians (13.8%) and Ancient North Eurasians (5.2%). The Native American (Paleo-American) component reflects the ancestry of the Indigenous peoples of the Americas. With well over half of the total, this single source dominates the profile.
Smaller traces of Arctic Siberian (Nganasan-related) (under 5%) also appear. At that level they can reflect real minor ancestry, but also simple model noise, so they should not be over-read. The fit is acceptable (fit distance 0.029): treat the proportions as a good approximation rather than exact values. This population was modelled with a global set of reference populations (ancient genomes, plus modern stand-ins where no suitable ancient genome exists), because West Eurasian sources alone cannot describe it.
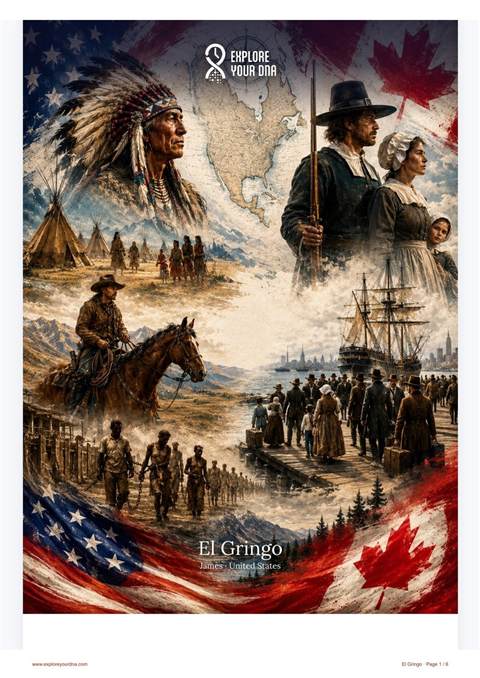
El Gringo – North American Bloodline
Closest modern populations to Navajo
Among the modern populations in the G25 data, the closest to the Navajo average is Oji-Cree, at a distance of 0.027 (close). Next come Crow at 0.028 and Hopi at 0.028. By the tenth closest (Amerindian (North)) the distance grows to 0.050, a common pattern for a population that shares ancestry with its neighbours while keeping a profile of its own.
| # | Population | Distance | Closeness |
|---|---|---|---|
| 1 | Oji-Cree | 0.0272 | Close |
| 2 | Crow | 0.0280 | Close |
| 3 | Hopi | 0.0281 | Close |
| 4 | Kiowa-Arapaho | 0.0302 | Close |
| 5 | Assiniboine | 0.0304 | Close |
| 6 | Sioux (Lakota) | 0.0312 | Close |
| 7 | Mandan-Arikara-Hidatsa | 0.0366 | Close |
| 8 | Creek | 0.0414 | Close |
| 9 | Choctaw | 0.0456 | Close |
| 10 | Amerindian (North) | 0.0504 | Moderate |
Distances are Euclidean distances between averaged G25 coordinates. On our scale, below 0.025 is very close, below 0.050 close, below 0.080 moderate, and beyond that distant.
Closest ancient populations to Navajo
If we search ancient DNA for the best match to Navajo, USA Washington Paleo-Indian Kennewick (Paleo-Indian period) comes first, at 0.038, with Canada Lucier 4845BP next. That is a close match: much of the modern profile was already present then, while later movements of people added further layers. A close ancient match is not proof of direct descent: it means those individuals carried a similar overall mix of ancestry.
| # | Ancient sample or group | Period | Distance |
|---|---|---|---|
| 1 | USA Washington Paleo-Indian Kennewick | Paleo-Indian period | 0.0375 |
| 2 | Canada Lucier 4845BP | c. 2900 BC | 0.0404 |
| 3 | Canada Teston Road 500BP Wendat | c. 1450 AD | 0.0458 |
| 4 | Canada Lucier 400BP | c. 1550 AD | 0.0481 |
| 5 | Canada Big Bar Lake 5700BP | c. 3750 BC | 0.0503 |
| 6 | Canada Atholville 400BP Mi'kmaq | c. 1550 AD | 0.0554 |
| 7 | Canada Lucy Island 6000BP | c. 4050 BC | 0.0595 |
| 8 | USA New Mexico Chaco Anasazi | Ancestral Puebloan, c. 800-1150 AD | 0.0679 |
| 9 | Mexico La Playa/Cerro de Trincheras 2400BP | c. 450 BC | 0.0689 |
| 10 | Mexico Postclassic Sierra Tarahumara | Postclassic Mesoamerica, c. 900-1520 AD | 0.0714 |
Ancient DNA from USA
Our ancient DNA database holds 421 individuals excavated in present-day USA, dated from about 10,762 BC to 1850 AD. The most frequent Y-DNA haplogroups among them are Q1b (78), O2a (64) and E1b (28), and the most frequent mtDNA haplogroups are E2 (115), A2 (72) and L3 (28). These are people who lived on the same land in the past, not necessarily ancestors of today's Navajo population.
Most frequent Y-DNA haplogroups
Ancient DNA studies on USA
- The genetic legacy of the 17th-century colonial capital of St. Mary’s City (2026)
- Picuris Pueblo oral history and genomics reveal continuity in US Southwest (2025)
- The genome of a Late Pleistocene human from a Clovis burial site in western Montana (2014)
Browse them in our ancient DNA database: 421 from USA.
Compare yourself with Navajo
Paste your G25 coordinates (scaled, one line, with or without a name in front) and we compute your genetic distance to the Navajo average and to its closest neighbours, right in your browser. Nothing is uploaded or stored.
| # | Population | Your distance | Closeness |
|---|
This list only covers Navajo and its neighbours. To find out which of our reports actually fits your DNA, run the free Report Finder: it runs the same fit test that every report uses before an order.
No G25 coordinates yet? Get a free simulated G25 from your raw DNA file, or order G25 coordinates.
About these numbers
Keep in mind that a population average is a statistical summary of a limited number of sampled individuals. Real people inside any group vary, some carry more of one ancestry and some less, and no genetic profile decides who is or is not Navajo. Use these numbers as a map of deep ancestry, not as a label.
Method: averaged G25 coordinates, Euclidean distances to other modern and ancient averages, and a non-negative least-squares model against deep ancestral reference populations (data generated 2026-10-01). Read the full method.
Go deeper than the average
This page describes the Navajo average. Your own DNA has its own story: El Gringo – North American Bloodline (15€) models your genome against the ancient sources and modern communities of the region, era by era, in a personal PDF report.
A report built only for the USA & Canada: pick your country and we model your DNA against the Native American peoples plus the British, French (Huguenot, Acadian, Cajun, Quebecois), German, Scandinavian, Italian, Eastern-European, Ashkenazi...
More populations from Americas
Frequently asked questions
What is the ancient genetic make-up of Navajo?
Modelled with deep ancestral reference populations, the Navajo average is about 77.8% Native American (Paleo-American), 13.8% Ancient Northeast Asians and 5.2% Ancient North Eurasians. These proportions are model estimates for a group average, not exact values for any one person.
Which populations are genetically closest to Navajo?
In the G25 data, the closest modern populations to the Navajo average are Oji-Cree, Crow and Hopi. The closest ancient matches are USA Washington Paleo-Indian Kennewick, Canada Lucier 4845BP and Canada Teston Road 500BP Wendat.
Can a DNA test tell me if I am Navajo?
No DNA test can confirm an ethnicity or a nationality. What DNA can show is how similar your genome is to the sampled Navajo average and to its neighbours. If you have G25 coordinates, paste them in the comparison box on this page to check that for free.
Which ExploreYourDNA report suits Navajo ancestry?
El Gringo – North American Bloodline is the report built for this heritage, and its reference panel fits the Navajo average closely. Your own DNA may differ from the average, so the free Report Finder checks every report against your file before you buy.
Where does the data on this page come from?
From the averaged Global25 (G25) coordinates of the sampled individuals: genetic distances to other modern and ancient population averages, and a non-negative least-squares model against deep ancestral reference populations. The full method is described at https://www.exploreyourdna.com/populations#method.