
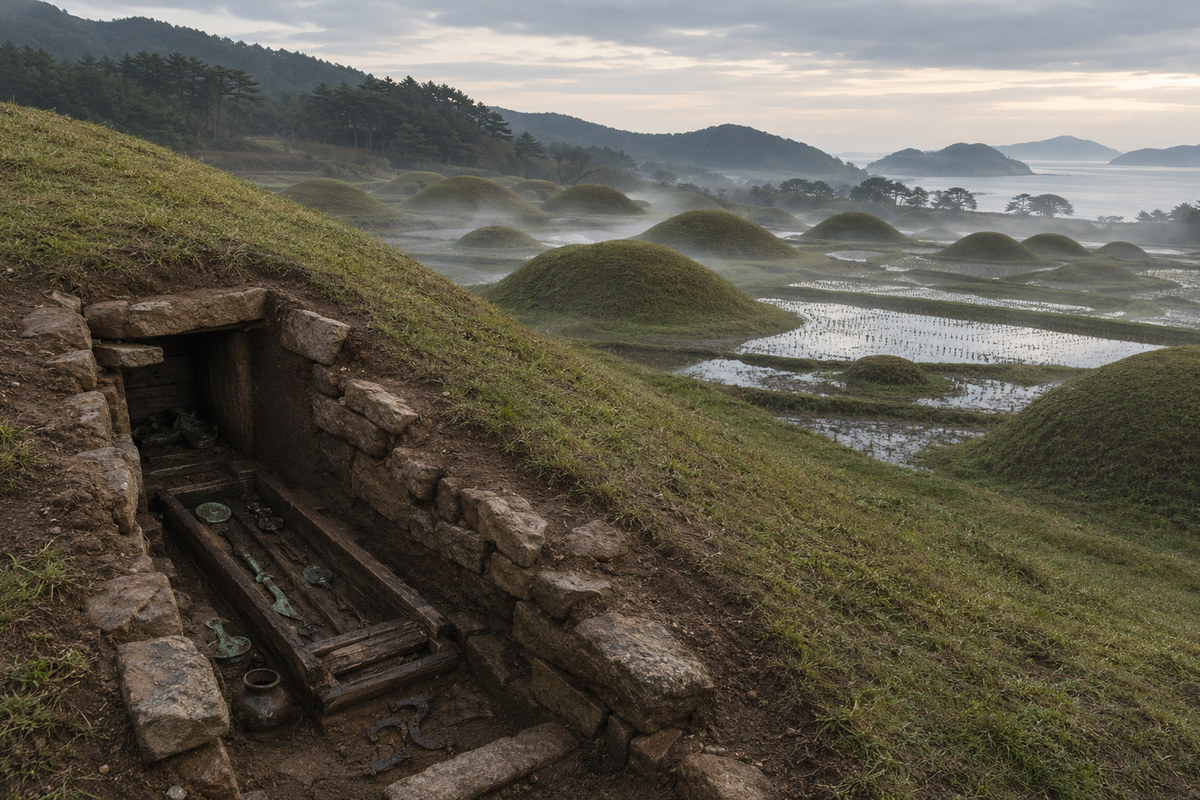
Korean population history is usually told as a sequence of three arrivals: millet farmers from the West Liao River in the Neolithic, rice farmers of the Mumun culture in the Bronze Age, and a northern kingdom called Goguryeo whose descendants supposedly gave the peninsula its final shape. Two of those three events are invisible in the genetic record, and the third turns out to have happened in the opposite direction from the one everybody assumes. This article measures what is actually there, using a pooled Global25 average of 128 present-day Koreans and, for the first time on this site, the fifty usable genomes from the Imdang-Joyeong cemetery at Gyeongsan, a Silla community of the fifth century AD published in April 2026.
Three questions, three different kinds of silence
The first question is the Mumun. Between roughly 1500 and 300 BC the southern half of the Korean peninsula acquired wet rice agriculture, plain undecorated pottery, the Songguk-ri house type, dolmen burial and a recognisable social hierarchy. John Whitman and others have argued that this package arrived from Shandong by way of Liaodong, that it carried the Japonic language family into Korea, and that the same population later crossed the strait and became the Yayoi of northern Kyushu. If that is right, the Mumun period is the single most consequential demographic event in Korean prehistory. The genetic evidence for it consists of exactly one low-coverage genome.
The second question is the Yayoi back-migration. In 2022 Pere Gelabert and colleagues published eight genomes from the Gaya confederacy at Gimhae, dated to the fourth and fifth centuries AD, and found that two of them carried a great deal of Jomon-related ancestry, one of them enough to plot inside the modern Japanese cluster. That individual, AKG_10203, was a richly furnished warrior burial with gold and bronze grave goods, and he carried Y haplogroup D-M64, a Jomon lineage. Two readings are possible. Either southern Korea retained a Jomon-like coastal substrate from its own Neolithic, or people came back across the strait from the archipelago into the Korean south, which would fit the Wa presence in Gaya recorded in Chinese and Japanese sources. The question this article can ask is whether Global25 can tell those two stories apart. It cannot, and the reason why is worth a section.
The third question is Goguryeo. The northern kingdom held Manchuria and the northern peninsula until 668, its ruling house claimed descent from Buyeo, and Korean national historiography has for a century treated it as the northern half of the Korean ethnogenesis. There is no Goguryeo ancient DNA. What there is, now, is a large southern Three Kingdoms sample and a modern Korean average, and the difference between them can be measured directly.
What the uniparental markers already said
Korean Y chromosomes have been typed repeatedly since the 1990s and the picture is stable. The dominant lineages are O2-M122, the standard northern Chinese and Han lineage, running at roughly 40 per cent, and O1b2-M176, which runs at about 30 per cent in South Korea and is otherwise concentrated almost entirely in the Japanese archipelago. Kim and colleagues in 2011 dated the O1b2 cluster to about 9,900 years and its Korean subclade O1b2-47z to about 4,400 years, and read the pattern as an expansion in the vicinity of the peninsula rather than an arrival from far away. C2-M217 runs at roughly 14 per cent in the south and about 20 per cent in the north, and N-M231 at a few per cent.
Two things about that distribution matter here. The first is that O1b2 is the lineage most often attached to the Mumun and Yayoi rice farmers, and it is shared between Korea and Japan at high frequency and almost nowhere else, which is consistent with the two populations having a recent common source but says nothing about which direction anybody moved. The second is that the Jomon paternal lineage, haplogroup D-M55 and its relatives, is effectively absent from modern Korea despite being present in a fifth-century Gaya warrior. Something happened to it between then and now.
The maternal picture adds little. Korean mitochondrial pools are dominated by the standard East Asian set, D4, B4, A, F, M7, M8 and G, with D4 the most common. Haplogroup M7a, the clearest Jomon maternal marker, is present in Japan at appreciable frequency and rare in Korea.
Data and method
Everything below uses Global25 scaled coordinates, with population averages merged from Davidski's published files and the Moriopoulos 2026 collection. Ancestry proportions come from non-negative least squares with a sum-to-one constraint imposed by appending a heavily weighted row of ones, with the resulting weights normalised. Distances are scaled Euclidean distances multiplied by one thousand, the convention used throughout this site.
The modern Korean target is a pooled average of 128 mainland individuals, built from a 102-individual average and a 26-individual Seoul sample weighted by size. It sits 2.2 units from Davidski's independent 48-individual Korean average, which is about as good agreement as two averages of the same population ever show. Jeju Islanders and the Korean community of Yanbian in northeastern China are kept separate throughout, because both turn out to be informative.
The ancient Korean side is much better served than it was three years ago. The Silla average used here comes from the Imdang-Joyeong burial complex at Gyeongsan in the southeast, published by Hyoungmin Moon and colleagues in April 2026 in Science Advances. That study analysed 78 individuals from 44 tombs built over about a century between the fourth and sixth centuries, in a community descended from the polity of Abdok that Silla absorbed in the fourth century. It is famous for sunjang, the practice of burying sacrificed retainers with the grave owner, and the authors found a dense kinship network, eleven first-degree and twenty-three second-degree pairs, and five individuals born to closely related parents. From the Global25 release of that dataset we use 50 individuals, dropping the six merged duplicate entries and six libraries below ten per cent coverage. Alongside it sit the eight Gaya genomes from Gimhae, three individuals from the Gunsan jar coffin at Dangbuk-ri, four Chulmun Neolithic sites and the single Bronze Age genome from Taejungni.
The Gunsan sample needs its own note, because the number that gets quoted for it is misleading. Don-Nyeong Lee and colleagues recovered genome-wide data from six individuals in a single small jar coffin at Dangbuk-ri, Gunsan, on the west coast, dated to the mid-sixth century AD. Those six are not six samples of a population. They are one extended family: among the fifteen possible pairs the authors found six first-degree, two second-degree and one third-degree relationships, and reconstructed a pedigree with a couple, their two children, a half-sibling of those children and a third-degree paternal relative of the father. Three of the four males carry the same paternal lineage, haplogroup Q, and three of the six share mitochondrial haplogroup D4c1b1. Averaging all six would be averaging one household. Following the authors' own procedure for group-level analysis, we use the three individuals they retained as minimally related, GUC002, GUC003 and GUC005. The six-individual average and the three-individual average sit 11.4 units apart, and every figure below moves by less than half a point when you swap them, but the three-individual version is the defensible one.
One panel does the work in every decomposition below, so that rows are directly comparable: the Amur Neolithic profile from Devil's Gate Cave in Primorye, Late Neolithic Yellow River farmers, the pooled Japanese Jomon average, and a southern East Asian pole from Late Neolithic Tanshishan in Fujian. The condition number of that source matrix is 10.8. Pole separations run from 153 units between Amur and Yellow River up to 252 at the far end, all of them comfortably above the hundred-unit threshold below which we treat two-source separation as unreliable on this site.
A word about what the Yellow River pole measures, because it is the point most easily misread. It is chosen for its position relative to the other three, not for its ethnonym. What it reports is the quantity of ancestry from the millet and rice farming populations of northern China, and that ancestry entered Korea in several waves over four thousand years. Calling its weight Chinese ancestry would be exactly the error this article is about.
Where the Koreans sit
The simplest measurement sets up everything else.
Every population within reach of the pooled Korean average, ranked by Global25 distance. A fifth-century Silla community sits closer than a present-day Korean from Jeju.
The nearest points are other Koreans: Davidski's average at 2.2, Seoul at 3.5, the Korean community of Yanbian in China at 5.9. And then, at 9.4 units, comes a group of fifty people buried at Gyeongsan between about AD 400 and 550. They are closer to the modern Korean average than Jeju Islanders are, at 14.1. They are three times closer than the Manchu of Liaoning at 29.3 or the Han of Shandong at 30.5, and they are closer than any living population on earth that is not itself Korean.
That is the central fact of this article. Fifteen centuries, the unification of the peninsula under Silla in 668, the Goryeo and Joseon dynasties, the Mongol domination of the thirteenth and fourteenth centuries, the Imjin war, Japanese colonial rule, and the modern Korean population has moved 9.4 units from a provincial Silla cemetery. For comparison, the internal spread of the modern Korean population, mainland to Jeju, is larger than that.
The rest of the ranking is orderly and unsurprising. The Gunsan jar-coffin family, on the west coast and a century later than Gyeongsan, sits at 19.2. Gaya at Gimhae sits at 30.0, further than the Han of northern China, which is the first sign that something unusual is going on at that site. Kofun Japanese sit at 32.2 and modern Japanese at 32.9, which is close enough to make the two populations obvious relatives and far enough to make them distinct. The Bronze Age and Neolithic sources of northern China cluster between 33 and 39.
Two entries at the bottom deserve attention. Yokchido, a single individual from a Middle Chulmun shell midden on a small island off the south coast dated to around 2000 BC, sits 175.7 units away, further than the Ulchi of the Amur. Jomon sits at 189.6. And the Taejungni Bronze Age genome sits at 139.6, which is a problem the next section is about.
The deep decomposition
Breaking the same populations into ancient components gives the shape of the Korean gene pool.
The same four-source panel applied to Koreans, their ancient predecessors, their neighbours and the Japanese archipelago.
Present-day Koreans come out at 73.4 per cent Yellow River farmer, 18.4 per cent Amur, 4.2 per cent Jomon and 4.0 per cent southern East Asian. Silla returns 68.5, 19.9, 7.0 and 4.6. Gunsan returns 64.9, 21.8, 9.5 and 3.7. Gaya returns 56.1, 23.0, 16.7 and 4.2.
The direction of travel through the last fifteen centuries is therefore a rise in the Yellow River component from about 69 to about 73 per cent, and a fall in the Jomon component from about 7 to about 4. Everything else is flat. The Amur fraction, which is the part of the Korean genome that comes from the pre-agricultural hunter-gatherers of the Russian Far East and the Manchurian forest, does not move at all: 19.9 in Silla, 18.4 today, and the difference is inside the noise of the model.
Against that, the controls behave as they should. The Manchu of Liaoning come out at 87.5 per cent Yellow River and 6.4 per cent Amur, which is a northern Chinese profile rather than a Tungusic one and reflects three centuries of large-scale Han settlement in Manchuria; the Han of northern China return 86.1 and 6.3. The Ulchi of the lower Amur, an actual unadmixed Tungusic population, take 100 per cent Amur. Modern Japanese return 58.7 Yellow River, 20.5 Amur and 19.7 Jomon, and the Kofun population that preceded them 55.7, 21.3 and 17.6, which reproduces the published figure of thirteen to fifteen per cent Jomon in Kofun and present-day Japan closely enough to be reassuring about the method.
The Mumun gap
Now the part where the evidence simply is not there.
The Bronze Age of the Korean peninsula, the period in which wet rice agriculture arrived, in which the population of the south is supposed to have been transformed, and from which the Yayoi migration to Japan set out, is represented in the ancient DNA record by one individual from Taejungni, sequenced at very low coverage and included in Robbeets and colleagues' 2021 dataset.
That genome sits 139.6 units from modern Koreans. It also sits 139 from Silla, 141 from Gaya, 138 from the Han of northern China, 143 from Late Neolithic Yellow River farmers and 138 from West Liao River Bronze Age. Being roughly equidistant from every continental East Asian population at once is not a genetic profile; it is what a low-coverage genome looks like when noise has pulled it toward the middle of the coordinate space. Its fit in the four-source model is 134.6 units, five times worse than any usable row in this article.
Gelabert and colleagues made the same point from the other direction in 2022. The earlier claim that this individual showed no Jomon-related ancestry, and therefore that the Jomon component had been fully diluted by the Bronze Age, was not supported once high-coverage Three Kingdoms genomes became available, because the statistical tools used could not carry that much missing data. The honest position is that the Mumun period has no autosomal evidence at all. Everything said about it below is inference from the periods on either side.
What the periods on either side do say is this. The Early Chulmun sites of Ando and Changhang, on the southern coast around 4600 BC, already carry a substantial Yellow River farming component, 48.7 and 18.6 per cent respectively, alongside Amur and Jomon-like ancestry. By the Three Kingdoms period the Yellow River component is between 56 and 69 per cent depending on the site. So the northern Chinese farming ancestry that dominates the Korean genome arrived progressively across the Neolithic and Bronze Age rather than in one event, and the Mumun rice expansion is one plausible pulse among several that the data cannot resolve individually.
The Jomon layer through time
The Jomon component is the one axis on which the Korean series does something interesting, so it is worth pulling out on its own.
Jomon weight under the identical four-source panel, from the Chulmun Neolithic to the present, with the Japanese series and three continental controls for scale.
The Chulmun rows at the top are dramatic and largely useless as a trend. Yokchido, a single individual from a small island, returns 87.3 per cent. Yondaedo, two low-resolution individuals, returns 59.6. Changhang returns 21.5 and Ando 16.7. These are single genomes and pairs from four different sites, their fit distances run from 35 to 124 units, and the spread between them is much more likely to be real local heterogeneity along a coastline than a chronological signal. Robbeets and colleagues reported roughly 95 per cent Jomon-related ancestry at Yokchido and only a small fraction at Changhang and Yondaedo, which is the same picture. The southern Korean coast in the Neolithic contained both maritime foragers who were essentially Jomon-like and farming communities who were essentially continental, sometimes within a few tens of kilometres of each other.
The Three Kingdoms rows are where the sample sizes finally allow a statement. Gaya at Gimhae returns 16.7 per cent, the Gunsan family 9.5, Silla at Gyeongsan 7.0. Modern mainland Koreans return 4.2, Jeju Islanders 10.7, Yanbian Koreans 3.4.
Two caveats have to be attached to those absolute numbers before they are used. The first is that our panel puts a floor under the Jomon estimate for any Korean-like population, which is why the continental controls matter: the Manchu return 0.3 per cent and the Han of northern China 0.6, so the 4.2 per cent in modern Koreans is a genuine excess over their nearest continental neighbours rather than a modelling artifact. The second is that these figures run consistently above published qpAdm estimates. Gelabert and colleagues put the low-Jomon Gaya cluster at 3.0 plus or minus 1 per cent and the high-Jomon cluster at 20.5 plus or minus 1.75; our group average of 16.7 sits between those and reflects the fact that we are averaging both clusters together. What the chart supports is the ordering and the size of the gaps, not the second decimal place.
The ordering is nonetheless clear and it is geographic rather than chronological. Gaya, on the south coast facing the Korea Strait, has more than twice the Jomon-related ancestry of Silla, an inland community a hundred and twenty kilometres away and contemporary with it. Moon and colleagues reported exactly this for Imdang-Joyeong: the community shows no evidence of Jomon-related admixture despite contemporary examples of such mixing in coastal areas. Gunsan, on the west coast, sits between the two, although one household is a thin basis for a regional statement.
Inside the Gaya sample the structure is individual rather than gradual. AKG_10203, the warrior burial with the Jomon Y chromosome, returns 37.7 per cent and sits 74.0 units from modern Koreans, closer to the modern Japanese average at 45.1 than to any Korean population. AKG_10207 returns 27.9. The other six run between 8.1 and 12.9. Inside the Silla sample there is no such structure at all: fifty individuals with a mean of 7.0 per cent, a standard deviation of 4.0, a maximum of 15.1, and no bimodality anywhere in the distribution. One coastal community contained people of two visibly different ancestries buried side by side, with no correlation to grave type or to whether the person had been sacrificed. One inland community did not.
Substrate or back-migration?
Which brings us to the question the title of this article promises, and to a negative answer that is worth stating carefully because it is a limit of the method rather than a finding about Korea.
If the Jomon-related ancestry at Gimhae is a survival of the local Chulmun coastal substrate, the source should look like the Neolithic foragers of the southern Korean islands. If it arrived with people coming back across the strait from the archipelago, the source should look like Jomon, or like the Yayoi and Kofun populations that were themselves part Jomon. Modelling Gaya as Silla plus one additional source ranks the candidates: the Korean Chulmun individual from Yokchido improves the fit by 53.4 per cent, Ryukyu Late Neolithic by 47.5, pooled Japanese Jomon by 46.7, modern Japanese by 38.6, Kofun by 37.3. Continental sources improve it by nothing at all.
The temptation is to read the top of that list as an answer. It is not one. Yokchido sits 45 units from the pooled Jomon average, and the internal spread of the Jomon samples themselves runs from 15 to 32 units. In other words the Korean Neolithic forager and the Japanese Neolithic foragers are the same genetic population to within the resolution of this dataset, separated by less than half the hundred-unit threshold at which we start trusting a two-source decomposition. A model cannot distinguish between two sources it cannot distinguish between.
So the honest statement is this. Something Jomon-like contributed roughly a sixth of the ancestry of the Gimhae population in the fourth and fifth centuries AD, and nothing continental will substitute for it. Whether those people were the descendants of Korean shell-midden foragers or recent arrivals from Kyushu is a question that Global25 cannot answer, and anybody who reports having answered it with a calculator has mistaken a label for a measurement. The archaeology and the uniparental markers are more likely to settle it: AKG_10203 carried Y haplogroup D-M64, which is found in Jomon burials at Funadomari, Sanganji, Toyama and Rokutsu, and which is essentially absent from the Korean peninsula today.
One row on the ladder is worth a note because it cuts against the simplest back-migration story. The Yayoi individuals from Kuma-Nishioda improve the Gaya fit by only 10.9 per cent, far below pure Jomon. That sample sits 90.7 units from modern Koreans and fits the deep panel poorly, at 81.2 units, so it should not be leaned on. But nothing in these data suggests that a Yayoi population as such is what the Gaya residual wants.
Jeju
The one place where a modern Korean population is measurably different from the rest is the island of Jeju, eighty kilometres off the south coast and more than twice as far from Kyushu.
Nine candidate second sources ranked by how much each improves the fit for Jeju Islanders when added to the mainland Korean average.
Jeju sits 14.1 units from mainland Koreans and 22.2 from Japanese, which puts it about a third of the way along that line. Its Jomon component is 10.7 per cent against 4.2 on the mainland, and it is 18.5 units from the Gaya average, closer than any mainland Korean sample is.
Modelling it as mainland Korean plus one source reproduces the Gaya result exactly. Yokchido improves the fit by 65.3 per cent and takes 7.5 per cent weight; Ryukyu Late Neolithic by 59.0, Gaya itself by 55.1, Jomon by 55.1, modern Japanese by 47.7. The Han of northern China improve it by nothing, the Ulchi by 4.4 per cent, Mongols by 15.2 with a weight of 4.7 per cent that is more likely to be absorbing a small unrelated residual than reporting anything real.
Jeju is therefore the place where the coastal Jomon-related layer that was general along the southern seaboard in the Three Kingdoms period survived at something like its old level, while the mainland absorbed and diluted it. That is the same explanation Gelabert and colleagues offered for the disappearance of the Gaya profile, and Jeju is the control that makes it credible: an island that stayed partly outside the peninsular marriage pool kept two and a half times as much of the component as the mainland did.
How much would have been visible?
A null result is worth nothing unless the method could have produced a positive one, so the detection floor was measured rather than assumed.
Synthetic Korean genomes built by adding a known amount of Jomon ancestry to the real pooled average, then pushed back through the same model.
Recovery is linear and close to one to one on top of the 4.24 per cent baseline. Inject one per cent and the model reports 5.20; inject three and it reports 7.11; inject five and it reports 9.03; inject ten and it reports 13.82. A genuine additional Jomon contribution to the modern Korean gene pool of even two per cent would therefore have been plainly visible at 6.2. The 4.2 per cent that is observed is the whole of it, and the gap between that and the 7.0 per cent measured in Silla is above the floor and worth taking seriously as a real dilution.
The Goguryeo question
Now the third question, and the one on which this article has something new to say.
Everything above concerns southern Korea, because that is where the ancient DNA comes from. Silla, Baekje and Gaya are all southern polities. Goguryeo held the north and Manchuria, its ruling house claimed descent from Buyeo, its territory overlapped with populations that we would call Tungusic today, and after its fall in 668 a large part of its population was resettled southward and absorbed into Unified Silla. If Goguryeo carried a distinctively northern ancestry, and if that ancestry entered the modern Korean gene pool after the seventh century, then modern Koreans should differ from fifth-century southerners in a specifically northern direction.
The test is direct. Model the modern Korean average as the Silla average plus one additional source, and see which sources improve the fit.
Seventeen candidate second sources ranked by how much each improves the fit for present-day Koreans when added to the Silla average.
They do not. Every northern source takes exactly zero weight: Heishui Mohe from early medieval Primorye, the Xianbei individual from Zhalainuoer, Mongols of Mongolia, Ulchi, Nivkh, Oroqen and the Amur Neolithic profile from Devil's Gate. Not small weights, not weights within noise. Zero, in a non-negative solver that will happily assign a fraction of a per cent to anything that shaves the residual.
What does improve the fit is entirely continental and agricultural. The Manchu of Liaoning take 18.1 per cent and improve the fit by 25.3; the Han of Shandong 17.2 per cent and 24.4; Late Neolithic Yellow River farmers 13.7 per cent and 23.2; the Han of northern China 16.9 and 22.9. And the Manchu row needs its own caution, because the Manchu of Liaoning are on our own deep panel 87.5 per cent Yellow River farmer and only 6.4 per cent Amur. They are not standing in for Tungusic ancestry here. They are standing in for a northern Chinese population that happens to live north of the Great Wall, which is what three centuries of Han settlement in Manchuria produced.
So the answer to the Goguryeo question, as far as the autosomal data can carry it, is that the drift of the Korean gene pool between the fifth century and the present runs toward the Yellow River and away from Jomon, and does not run toward Manchuria at all. Whatever Goguryeo contributed, either it was already present in southern Korea in the fifth century, or it was not genetically distinct from the southern population to begin with, or it was demographically too small to see. The last of those is unlikely given the scale of the seventh-century resettlements. The middle one is the most economical reading: Goguryeo, Baekje and Silla were politically at war for three centuries and genetically the same people.
That reading has one loose end and it should be stated. There is no ancient DNA from Goguryeo, from Buyeo, or from anywhere in the northern half of the peninsula. The claim being made here is not that a Goguryeo sample would look like Silla; it is that modern Koreans do not require any northern source beyond what Silla already had. Those are different claims, and only the second one has been tested.
Does the choice of Jomon source matter?
This is the objection that has to be answered with numbers, because the Jomon pole is load-bearing in three of the sections above.
Eight Jomon-related reference populations, spanning Hokkaido to the Ryukyus and including the Korean Chulmun individual from Yokchido. The ranking never changes.
It does not matter. Under the pooled Jomon average, present-day Koreans return 4.2 per cent; under IK002 alone 3.9; under Honshu Early Jomon 4.2; under Funadomari from Hokkaido 4.1; under Shikoku Late Jomon 4.8; under the Korean Chulmun individual from Yokchido 4.2; under Ryukyu Late Neolithic 4.5. The ranking across populations is identical under every one of them: Japanese above Gaya, Gaya above Jeju, Jeju above Silla, Silla above mainland Koreans, all of them far above the Manchu.
The last row is a deliberate stress test. The Ainu of Sakhalin are not a Jomon population; they are the modern descendants of one, with several centuries of Okhotsk and mainland admixture on top. Substituting them raises the Gaya figure from 16.7 to 20.2 and the Japanese figure from 19.7 to 24.6, because a source that has drifted away from the Jomon pole has to be admitted in larger quantities to explain the same displacement. It does not change the order. What the choice of source controls is the scale, not the ranking.
The trap that catches most home modelling
Having established that the answer is robust to the Jomon pole, it is worth showing where the real fragility lies, because it is not where most people look.
Nine versions of the same two-source model, differing only in which northern proxy is offered alongside Jomon. The Jomon estimate for present-day Koreans swings by a factor of seven.
Offer the model exactly two sources, a northern proxy and Jomon, and ask it how much Jomon a modern Korean is. With Miaozigou Middle Neolithic as the northern proxy it returns 23.5 per cent. With Late Neolithic Yellow River it returns 8.3. With West Liao River Bronze Age 6.0, with Late Neolithic West Liao River 4.4, with the modern Han of Shandong 3.5.
Seven-fold variation, from the same target, from the same Jomon source, purely as a function of which northern population was offered. The diagnostic is in the fit distances, which run from 29.7 to 52.2 units across those nine models, all of them poor and none of them distinguishable enough from the others to prefer one. When the composition moves that far and the fit does not, the model is not choosing between the sources on the evidence; it is filling a residual with whatever lies along it.
The reason is that all of these northern proxies sit at almost exactly the same distance from Jomon, between 194 and 200 units, but at very different distances from the Korean target. A proxy that is itself slightly displaced toward Jomon, as Miaozigou is, leaves a residual that only Jomon can fill. The four-source model avoids this because the Amur and southern East Asian poles absorb the parts of the residual that a two-source model has nowhere to put.
This is the single most common way that Global25 hobbyist modelling produces confident nonsense about Koreans and Japanese specifically. Anyone reporting that Koreans are twenty per cent Jomon, or that they are zero per cent Jomon, is reporting a property of their northern proxy.
That is not a private finding of this site. Lee and colleagues hit the same wall from inside a formal qpAdm framework and reported it plainly. Using West Liao River Bronze Age as the northern proxy, they detected no statistically significant Jomon contribution in either the Gunsan individuals or present-day Koreans. Replacing that single source with Miaozigou Middle Neolithic, and changing nothing else, produced a small but significant Jomon signal of 3.1 to 4.4 per cent in both. They preferred West Liao River on grounds of geographic and temporal proximity, which is a judgement about archaeology rather than about the arithmetic. Our two-source figures move in exactly the same direction and by a much larger margin, 6.0 per cent under West Liao River against 23.5 under Miaozigou, which is the expected inflation of unconstrained least squares over a properly weighted estimator. Two different methods, the same instability, from the same swap.
Limits
Six caveats matter. First, there is no ancient DNA from northern Korea, from Goguryeo, from Buyeo or from anywhere in the peninsula outside the southern third, and the Goguryeo section above tests only what modern Koreans require, not what Goguryeo was. Second, the Mumun period is represented by one unusable genome; every statement about the Bronze Age here is interpolation. Third, the Chulmun sites are single genomes and pairs with poor fits, and the enormous spread between Yokchido and Ando should be read as sampling along a heterogeneous coastline rather than as a chronological trend. Fourth, the absolute percentages in the deep model run above published qpAdm figures for the same populations, and it is the gaps between rows, not the values, that carry the argument. Fifth, the Gunsan row rests on three unrelated individuals drawn from a single household in a single jar coffin, at autosomal coverage between 0.3 and 1.8, and should be read as one data point rather than as a regional average. Sixth, the Silla sample comes from one cemetery of one lineage-dense community practising close-kin marriage, which is precisely the situation in which a local group can drift away from its own regional average; that it lands 9.4 units from modern Koreans anyway is reassuring, but it is one site.
Conclusion
The Korean gene pool as it stands today is about three quarters northern Chinese farming ancestry, about a fifth Amur hunter-gatherer ancestry inherited from the pre-agricultural populations of Manchuria and the Russian Far East, and a residue of four per cent from the Jomon-related foragers who occupied the southern coasts.
Of the three events this article set out to measure, the Mumun rice expansion cannot be seen because the single Bronze Age genome is unusable, and the arrival of the northern Chinese farming component looks progressive across the Neolithic and Bronze Age rather than concentrated in one pulse. The Jomon-related ancestry of southern Korea is real, was still running at a sixth of the genome in coastal Gimhae in the fifth century AD while being absent from inland Gyeongsan at the same date, and has since fallen to four per cent on the mainland while surviving at eleven on Jeju; whether it was a local substrate or a back-migration from the archipelago is a question this method is not sharp enough to answer, because the Korean and Japanese Neolithic foragers are the same population to within its resolution. And Goguryeo, the one of the three that Korean historiography has leaned on hardest, is invisible: modern Koreans need no northern, Manchurian or Tungusic source at all beyond what a fifth-century Silla farmer already carried.
What changed between Silla and the present was a slow drift of four points toward the Yellow River and three points away from Jomon. Fifteen centuries of history for seven percentage points. It is one of the flattest series this site has ever measured.
Korean_mainland_pooled_(n=128),0.022249,-0.455163,0.017115,-0.063909,0.039005,0.012836,0.005111,0.003218,-0.009044,0.006761,-0.074590,-0.008566,0.009916,-0.005437,-0.009160,-0.002582,0.000781,0.001661,-0.000705,-0.007999,0.016349,-0.004606,0.007626,0.000871,-0.017538
Korean_Jeju_Island_(n=47),0.023201,-0.445104,0.015630,-0.059762,0.036282,0.011369,0.003330,0.002391,-0.006963,0.007751,-0.073265,-0.008539,0.010273,-0.004940,-0.008972,-0.002821,0.000191,0.003092,-0.000297,-0.007195,0.018712,-0.007172,0.008037,0.002274,-0.023677
Korean_Yanbian_Antu_(n=18),0.022195,-0.454337,0.019212,-0.063146,0.037648,0.012442,0.005248,0.003769,-0.007806,0.006550,-0.074960,-0.009183,0.010836,-0.003395,-0.009191,-0.004302,-0.000340,0.000275,0.000161,-0.008053,0.014821,-0.004101,0.006758,0.000656,-0.014503
Korea_Silla_Imdang_Joyeong_(n=50),0.020966,-0.450936,0.017981,-0.064232,0.038530,0.012243,0.002956,0.002271,-0.007212,0.008627,-0.073188,-0.006909,0.009285,-0.004087,-0.007945,-0.003702,-0.000730,0.001913,0.001096,-0.008912,0.019321,-0.005992,0.006976,-0.000374,-0.022702
Korea_Gunsan_Dangbuk-ri_unrelated_(n=3),0.016694,-0.446156,0.022250,-0.059217,0.037750,0.012178,0.005954,0.005154,-0.000614,0.006379,-0.072642,-0.005245,0.007334,-0.003762,-0.010134,-0.002829,0.004867,0.005025,-0.003184,-0.010005,0.020006,-0.008326,0.004601,-0.000843,-0.022712
Korea_Gaya_Gimhae_(n=8),0.020773,-0.437186,0.015886,-0.055717,0.035507,0.012236,0.003261,0.002452,-0.003912,0.012392,-0.069381,-0.008299,0.011688,-0.002391,-0.008516,-0.008701,-0.000733,0.001472,0.000723,-0.005674,0.021103,-0.016570,0.003605,0.000136,-0.030252
Primorye_N_Devils_Gate_Cave_(n=6),0.017643,-0.445310,0.072596,-0.051088,-0.039956,-0.040671,0.003212,0.009653,0.009237,0.020258,-0.048230,-0.006045,-0.000149,0.010023,-0.010654,-0.013149,-0.001369,0.008805,0.015566,0.010672,0.009629,-0.029883,-0.017521,-0.003434,-0.011436
China_YR_LN,0.015935,-0.449880,0.009805,-0.065338,0.053812,0.022271,0.003894,0.002769,-0.009759,0.005571,-0.082818,-0.010298,0.012084,-0.008533,-0.008531,-0.001534,0.002310,-0.000362,-0.004220,-0.007646,0.016560,0.010405,0.015177,0.000224,0.008553
Japan_HG_Jomon,0.010699,-0.346092,-0.053023,0.012274,0.037915,0.015227,-0.002773,-0.000785,0.025606,0.018989,-0.050178,-0.008333,0.009098,-0.006386,-0.024810,-0.017051,0.005346,0.009401,0.003922,-0.004877,0.063887,-0.045380,0.007814,0.012291,-0.098410
China_Fujian_LN_Tanshishan_(n=1),0.005691,-0.427538,-0.041860,-0.058463,0.123408,0.055778,-0.008460,-0.018230,-0.020043,-0.024055,0.035076,0.000300,-0.004906,0.003578,-0.000271,0.014585,0.001825,0.001267,0.003017,-0.012256,0.005865,-0.009398,0.002958,-0.007832,-0.033410
Korea_MN_Middle_Chulmun_Yokchido_(n=1),0.028456,-0.346296,-0.026398,0.005814,0.023697,0.013387,-0.007755,-0.000692,0.024952,0.012210,-0.053751,-0.004946,0.008771,-0.000826,-0.018865,-0.017634,0.012126,0.010388,0.006411,0.011631,0.066009,-0.043402,-0.002711,0.017472,-0.087178
Korea_EN_Early_Chulmun_Ando_(n=2),0.012521,-0.448864,0.002074,-0.058625,0.056472,0.017989,0.008930,0.006923,-0.002761,0.012392,-0.066904,-0.023904,0.011818,0.008257,-0.003801,0.005038,-0.005868,0.011909,0.012821,-0.006128,0.029074,-0.027637,-0.012202,-0.013134,-0.041853
China_WLR_BA,0.024472,-0.447848,0.027718,-0.056202,0.020311,-0.001534,0.000822,0.007038,-0.003171,0.006013,-0.065524,-0.001948,0.010630,-0.002959,-0.008686,-0.002254,0.005085,-0.001393,-0.002703,-0.002939,0.004554,0.001174,0.003636,-0.002711,-0.003952
China_WLR_LN,0.013659,-0.442771,0.011502,-0.062985,0.042315,0.013805,0.002468,0.003577,-0.013499,0.010934,-0.085822,-0.009742,0.010035,-0.003372,-0.008075,0.004508,0.006194,0.003484,0.000315,-0.004252,0.019716,0.007790,0.012694,0.007531,0.003293
China_Miaozigou_MN,0.020488,-0.454957,0.030547,-0.064277,0.009848,0.010877,0.007520,-0.000923,-0.014317,0.016583,-0.075998,-0.016485,0.019029,-0.013349,-0.004343,0.006762,0.006910,-0.003167,-0.020992,-0.000250,-0.013351,0.026833,0.015159,0.002651,0.026105
China_Shandong_EBA_Yueshi_Chengziya_(n=1),0.022765,-0.452926,0.022627,-0.059432,0.050779,0.017012,0.014806,-0.001846,-0.022089,-0.004374,-0.067391,-0.010491,0.005352,-0.003165,-0.017779,-0.003978,-0.003781,0.004434,-0.006788,-0.022386,0.019840,-0.003215,0.007025,0.006386,-0.001078
Han_Beijing_(Northern_China_Profile)_(n=65),0.023343,-0.446599,0.008587,-0.064078,0.051058,0.020973,0.005286,0.001832,-0.010629,0.003594,-0.072520,-0.008826,0.011063,-0.005933,-0.007310,-0.001075,0.000594,-0.000138,-0.003349,-0.008862,0.010904,0.007107,0.012232,0.000892,0.001022
Han_Shandong,0.022132,-0.448639,0.005363,-0.060114,0.051531,0.021258,0.006189,0.000436,-0.010726,0.003564,-0.073490,-0.008742,0.010291,-0.008762,-0.007842,-0.000044,0.001434,0.001337,-0.001201,-0.008449,0.010967,0.006608,0.011613,0.001058,-0.000492
Manchu_Liaoning_(n=96),0.022492,-0.447965,0.008784,-0.064893,0.049631,0.020565,0.004972,0.002173,-0.011673,0.004677,-0.074497,-0.008330,0.010790,-0.006110,-0.008084,-0.000631,0.000584,0.000672,-0.004196,-0.010186,0.011212,0.007630,0.010977,0.000287,0.000861
Ulchi_(n=23),0.028703,-0.441535,0.084918,-0.037061,-0.069096,-0.044695,0.011516,0.014648,0.012787,0.018192,-0.022353,0.001095,-0.002611,0.000742,-0.009636,-0.010186,-0.001610,0.009816,0.024385,0.018161,0.013742,-0.039160,-0.014934,0.006308,-0.005404
Primorye_Early_Medieval_Heishui_Mohe_(n=2),0.035285,-0.370161,0.039787,-0.041828,0.018773,0.002371,0.013631,0.012230,-0.000920,0.009111,-0.050341,-0.007794,0.005947,-0.004266,-0.009229,-0.007690,-0.003912,-0.000887,0.000189,0.002188,0.001497,-0.003153,0.001295,0.000663,-0.005449
China_Inner_Mongolia_IA_Xianbei_Zhalainuoer_(n=1),0.034147,-0.437693,0.104462,-0.042959,-0.082785,-0.058846,0.025616,0.029306,0.015953,0.014032,-0.036375,-0.005545,-0.005054,0.006055,-0.006515,-0.012198,0.005998,-0.002534,0.000126,0.029264,-0.021462,-0.016940,-0.032784,-0.003253,0.005389
Japanese_(n=476),0.018943,-0.442662,0.013179,-0.055994,0.034415,0.009253,0.002746,0.002571,-0.004892,0.009949,-0.074367,-0.008738,0.009687,-0.004181,-0.011531,-0.006185,-0.000776,0.003902,0.001682,-0.007967,0.027601,-0.016179,0.007458,0.003097,-0.039300
Japan_Honshu_Kofun.SG,0.018591,-0.443786,0.010685,-0.056417,0.033032,0.014409,0.000235,0.001846,-0.004431,0.006136,-0.068636,-0.006394,0.011645,-0.004679,-0.007645,-0.005922,-0.003260,0.003209,0.001173,-0.008087,0.028990,-0.015828,0.002711,0.002932,-0.035446
Japan_Ryukyu_LN_Nagabaka_(n=3),0.020868,-0.340202,-0.040603,0.012274,0.036930,0.015897,-0.006267,-0.008461,0.027611,0.024602,-0.050286,-0.012539,0.017492,-0.011606,-0.024203,-0.013745,0.008388,0.010895,0.009008,-0.013632,0.064428,-0.041465,0.004108,0.000522,-0.106457
Global25 coordinates by Davidski (Eurogenes). Population averages from the Moriopoulos Collection 2026. Models can be reproduced in Vahaduo using the blocks above.
References
- 2011 Kim S.H., Kim K.C., Shin D.J., Jin H.J., Kwak K.D., Han M.S., Song J.M., Kim W., Kim W. High frequencies of Y-chromosome haplogroup O2b-SRY465 lineages in Korea: a genetic perspective on the peopling of Korea. Investigative Genetics 2: 10.
- 2011 Whitman J. Northeast Asian Linguistic Ecology and the Advent of Rice Agriculture in Korea and Japan. Rice 4(3-4): 149-158.
- 2021 Robbeets M., Bouckaert R., Conte M., et al. Triangulation supports agricultural spread of the Transeurasian languages. Nature 599: 616-621.
- 2021 Wang C.C., Yeh H.Y., Popov A.N., et al. Genomic insights into the formation of human populations in East Asia. Nature 591: 413-419.
- 2022 Gelabert P., Blazyte A., Chang Y., Fernandes D.M., Jeon S., Hong J.G., et al. Northeastern Asian and Jomon-related genetic structure in the Three Kingdoms period of Gimhae, Korea. Current Biology 32(15): 3232-3244.
- 2022 Tian Z., Wang L., Wang C.C. Human genetics: The dual origin of Three Kingdoms period Koreans. Current Biology 32(15): R832-R834.
- 2022 Tian Z., et al. Triangulation fails when neither linguistic, genetic, nor archaeological data support the Transeurasian narrative. bioRxiv 2022.06.09.495471.
- 2022 Lee D.N., Jeon C.L., Kang J., Burri M., Krause J., Woo E.J., Jeong C. Genomic detection of a secondary family burial in a single jar coffin in early Medieval Korea. American Journal of Biological Anthropology 179(4): 585-597.
- 2024 Kim J., et al. Genetic analysis of a Yayoi individual from the Doigahama site provides insights into the origins of immigrants to the Japanese Archipelago. Journal of Human Genetics.
- 2026 Moon H., et al. Ancient genomes reveal an extensive kinship network and endogamy in a Three-Kingdoms period society in Korea. Science Advances 12, eady8614.