
Ancient DNA | Mainland France
Celtic, Roman or Germanic?
From the hunter-gatherers to the Franks: the ancestry of mainland France mapped region by region
France was not built in one go. Hunter-gatherers, the first farmers, Bronze Age newcomers carrying steppe ancestry, the Gauls, Rome and the Germanic peoples all left a trace in the DNA of the French. How much of each, and where? We read the averages of the ExploreYourDNA France project at three depths: the deep roots, the Bronze Age turnover, then Late Antiquity with Karl O. Hogstrom's Migration Era Calculator. This article covers mainland France: Corsica and the Basque Country are left out of every average, and the Basques get their own section at the end, because they are the clearest genetic outliers of the region.
The method in short
For the deep levels we used the averages of the ExploreYourDNA France project: 112 people from mainland France, grouped into 20 historic regions, from Brittany and Alsace to Limousin and Languedoc-Roussillon. These are the same averages you will find in our G25 tools, labelled for example "France (Brittany, N=17)". We modelled each of them with averages of published ancient genomes. The département maps use ExploreYourDNA's individual French reference samples (113 people in 49 départements). Level 1 uses the three classic sources of European ancestry: western hunter-gatherers (Mesolithic France, Luxembourg, Germany and England), the first Anatolian farmers (Barcın, north-west Turkey) and the Yamnaya herders of the Pontic-Caspian steppe. Level 2 uses sources closer in time: the Neolithic farmers of France, the Bell Beaker people of Central Europe and the population of Imperial Rome. Level 3 is Karl O. Hogstrom's calculator, which models each département average with peoples of Late Antiquity (0 to 550 CE): Celts, the Roman Empire and the Germanic peoples. Without Corsica, it covers 48 départements.
Level 1: hunter-gatherers, farmers and steppe herders
On average, mainland France is about 12% hunter-gatherer, 46% Anatolian farmer and 42% steppe. Like almost every European population, the French descend from all three. The farmers brought most of the ancestry in the Neolithic and absorbed part of the local hunter-gatherers; then, from about 2500 BCE, newcomers carrying steppe ancestry replaced a large part of that Neolithic population. But the balance changes a lot from one region to another.
Steppe ancestry: strongest in Brittany and the north
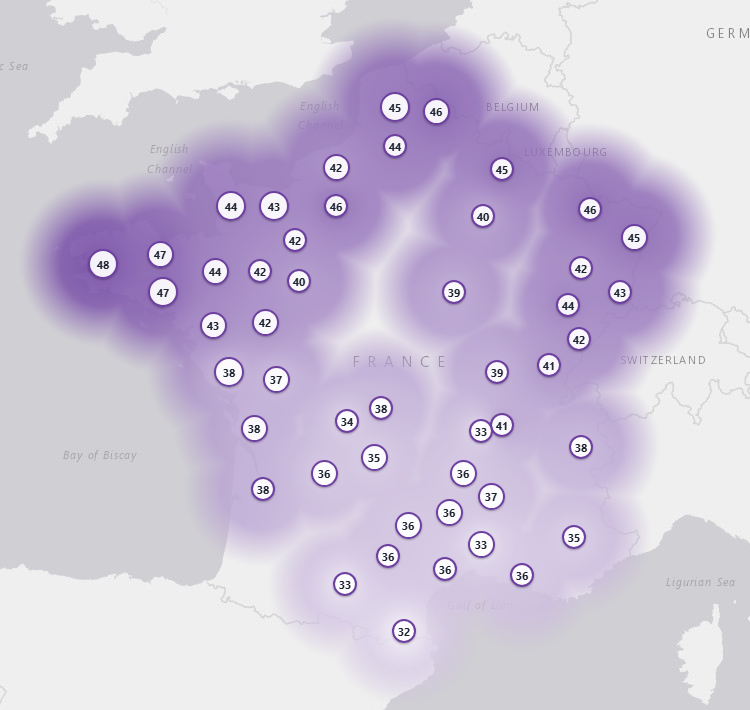
Steppe ancestry draws a clear gradient from the north-west to the south. It peaks in Brittany (Finistère 48%, Morbihan and Côtes-d'Armor 47%), in Nord and Moselle (46%), and falls to 32 to 33% in Gard, Haute-Garonne and Pyrénées-Orientales. Brittany (47%) is at the level of England here (48% in the same model), which fits the Atlantic Bronze Age world that linked Armorica, Britain and Ireland, and the later arrival of Britons from Britain. The south (34% in Languedoc-Roussillon, 35% in Midi-Pyrénées) received much less of it.
Farmer ancestry: strongest along the Mediterranean
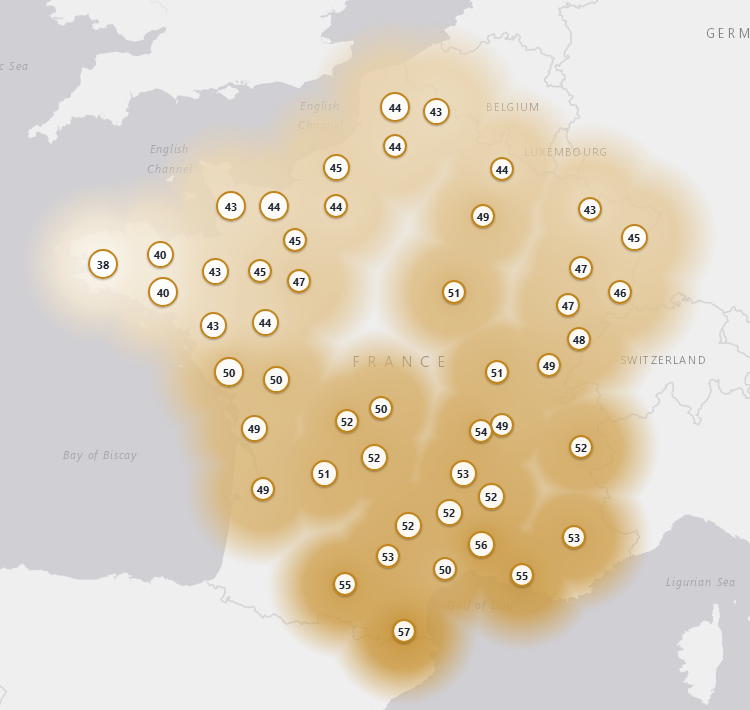
The farmer share is the mirror image: Pyrénées-Orientales 57%, Gard 56%, Bouches-du-Rhône and Haute-Garonne 55%, down to 38% in Finistère. Two things add up in the south: more of the Neolithic population survived the Bronze Age turnover there, and the Mediterranean coast later received people from Italy and the eastern Mediterranean, who also carry a lot of farmer ancestry.
Hunter-gatherer ancestry: a western edge
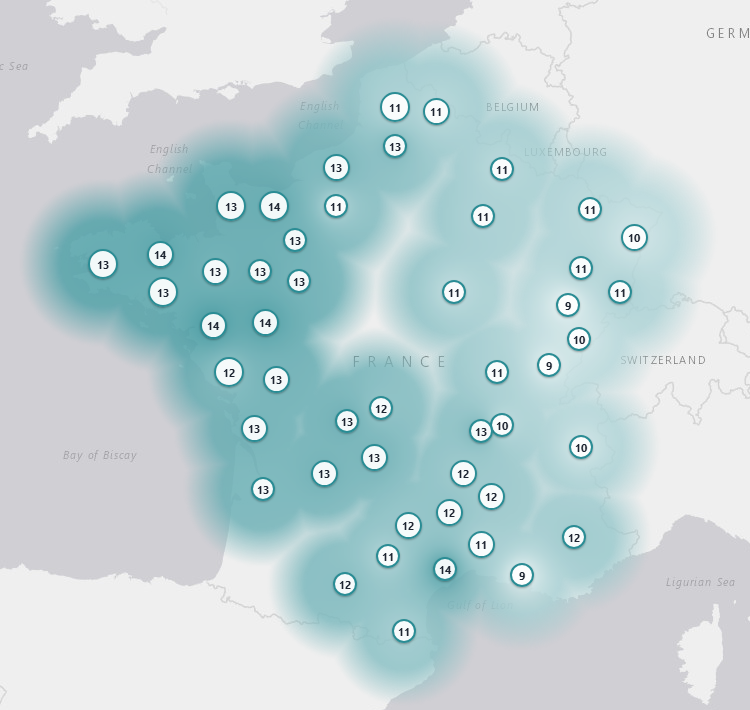
The hunter-gatherer share varies less, between 9% and 14%, but it follows a pattern. It is highest in the west: Loire-Atlantique 14%, Maine-et-Loire 14%, then Côtes-d'Armor, Calvados, Finistère and Manche around 13%. It is lowest in the east: Haute-Saône, Jura, Doubs, Savoie and Bas-Rhin, 9 to 10%. Part of this gradient may go back to the Neolithic, when farmers mixed with local hunter-gatherers in different proportions from region to region; part comes from the Bronze Age newcomers, who themselves carried some hunter-gatherer ancestry.
Level 2: the Bell Beaker turnover
With sources closer in time, the French average becomes about 80% Bell Beaker, 15% extra Neolithic France and 5% Roman Italy. The Bell Beaker people were themselves about half steppe and half earlier European ancestry, so this does not mean that 80% of the ancestors of the French were steppe herders. It means that most of the French gene pool goes back to the population that formed after 2500 BCE, when the Bell Beaker culture spread across Western Europe. The "extra Neolithic" share is what survived of the earlier farmers on top of that, and the "Roman Italy" share stands for later Mediterranean ancestry.
The regional contrast is striking. In Brittany the Bell Beaker share reaches 94%, with only 6% extra Neolithic and no Roman Italy at all. In Languedoc-Roussillon and Midi-Pyrénées it falls to 61 and 64%, with about a quarter of extra Neolithic ancestry and 11 to 13% Roman Italy. In the deep sense, the French are still largely the descendants of the Bronze Age and Iron Age population of Gaul: of all the ancient groups we tested, the French average is by far the closest to the Iron Age Gauls (Global25 distance 0.012), ahead of the Bell Beakers (0.035), the Anglo-Saxons (0.045), Imperial Rome (0.125) and the Neolithic farmers of France (0.148).
| Historic region | Level 1: WHG / farmers / steppe | Level 2: Neolithic / Beaker / Rome | n |
|---|---|---|---|
| Brittany | 17 | ||
| Lower Normandy | 13 | ||
| Upper Normandy | 10 | ||
| Nord-Pas-de-Calais | 13 | ||
| Picardy | 1 | ||
| Champagne-Ardenne | 2 | ||
| Lorraine | 2 | ||
| Alsace | 3 | ||
| Pays de la Loire | 8 | ||
| Centre-Val de Loire | 1 | ||
| Burgundy | 3 | ||
| Franche-Comté | 4 | ||
| Poitou-Charentes | 10 | ||
| Limousin | 5 | ||
| Aquitaine | 2 | ||
| Auvergne | 2 | ||
| Rhône-Alpes | 6 | ||
| Midi-Pyrénées | 4 | ||
| Languedoc-Roussillon | 5 | ||
| Provence-Alpes-Côte d'Azur | 1 | ||
| Mainland France (project average) | 112 |
Level 3: Celtic, Roman or Germanic?
On the last layer, Karl O. Hogstrom's calculator splits mainland France into 34.4% Germanic, 34.2% Roman Empire and 27.3% Celtic, with only 4.1% left for all other sources (average of the 48 départements, each counting once; average fit distance 0.0081, a good fit). Without Corsica, Germanic and Roman are almost tied. Remember that the three sources share the same deep roots: here, "Celtic", "Roman" and "Germanic" mean the populations of Gaul and Britain, of the Roman Empire and of the Germanic world between 0 and 550 CE.
Where the Celtic ancestry is strongest
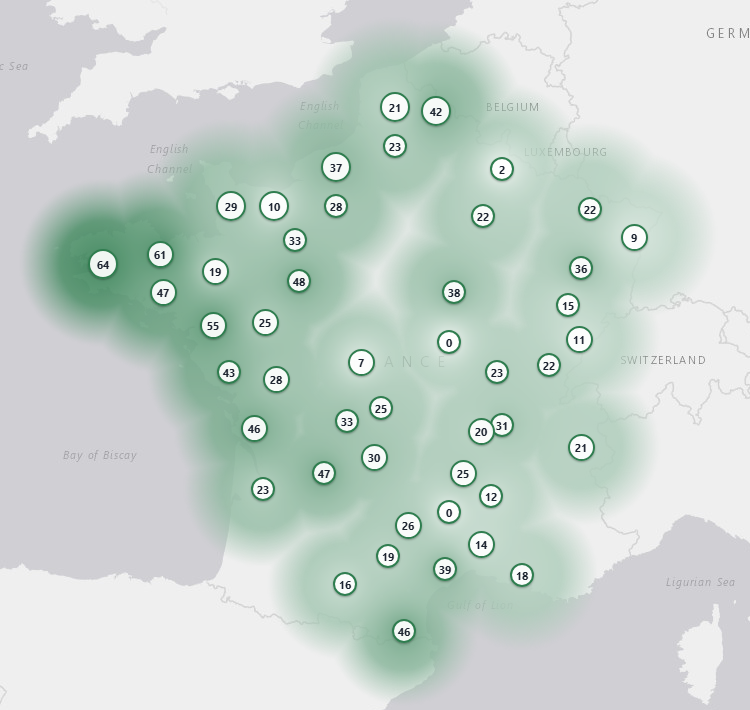
The Celtic source forms a clear Atlantic pole. Western Brittany leads by far: Finistère 63.6%, Côtes-d'Armor 60.8% and Morbihan 47.2%, followed by Loire-Atlantique (54.8%), which belonged to historical Brittany around Nantes. This fits the old Armorican population, reinforced by the Britons who crossed from Britain in the 5th and 6th centuries and gave Brittany its name and its language. The Celtic share stays high along the Atlantic coast (Charente-Maritime 45.6%, Dordogne 46.8%) and drops in the east and the south-east.
Where the Germanic ancestry is strongest
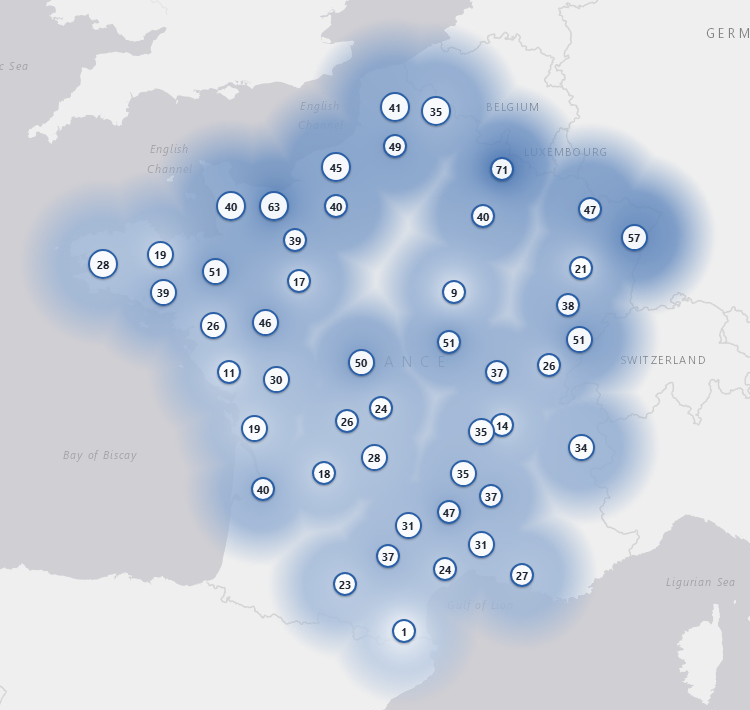
The Germanic source peaks in the north and the north-east: Ardennes 71.2% (one individual), Calvados 62.8%, Bas-Rhin 57.4% and Moselle 47.2%. Alsace and Lorraine match the Alemannic and Frankish settlement of the region, where Germanic dialects are still spoken. Normandy is a special case: the Saxons settled around Bayeux in the 6th century, and the Vikings arrived in the 10th. As the calculator stops at 550 CE, the Norse contribution can only appear as "Germanic". At the other end, the Germanic share is almost absent in Pyrénées-Orientales (1.4%).
Where the Roman ancestry is strongest
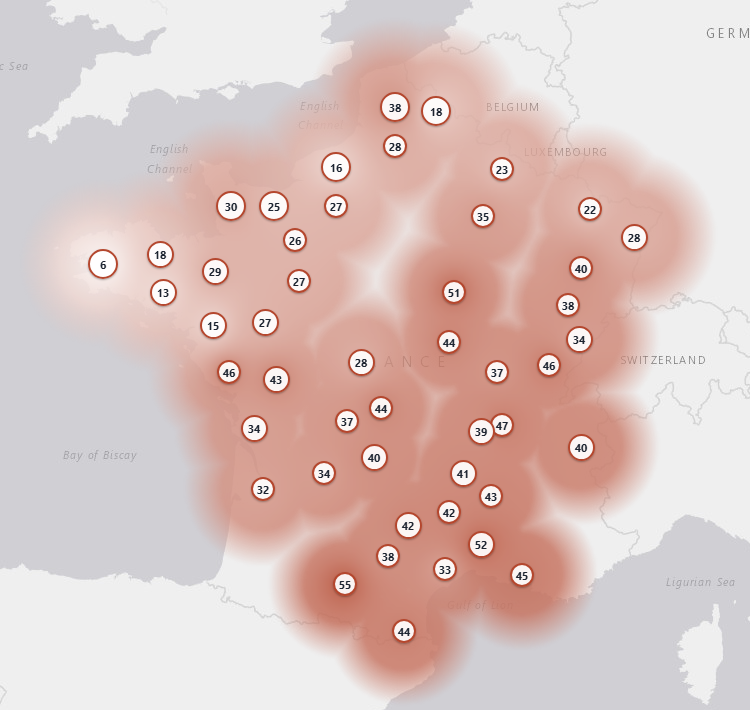
The Roman Empire source rises towards the south and the Mediterranean: Haute-Garonne 55.4%, Gard 52.2%, Yonne 51.0% (one individual) and Rhône 47.0%, the land of Lugdunum, capital of the Roman Gauls. Brittany is the least Roman region (11.2%), with Finistère at only 5.6%. A similar pattern appears in the deep model with the Roman Italy share, close to zero in the west and highest in the south-east and the east: two independent methods point the same way.
Region by region: the 20 historic regions of the project
| Historic region | WHG | Farmers | Steppe | Beaker | Celtic | Germanic | Roman | n |
|---|---|---|---|---|---|---|---|---|
| Brittany | 14% | 39% | 47% | 94% | 56% | 31% | 11% | 17 |
| Lower Normandy | 13% | 43% | 44% | 87% | 23% | 48% | 28% | 13 |
| Upper Normandy | 12% | 42% | 46% | 89% | 36% | 44% | 17% | 10 |
| Nord-Pas-de-Calais | 12% | 44% | 44% | 84% | 28% | 39% | 31% | 13 |
| Picardy | 13% | 44% | 44% | 87% | 23% | 49% | 28% | 1 |
| Champagne-Ardenne | 11% | 47% | 42% | 78% | 12% | 55% | 29% | 2 |
| Lorraine | 11% | 45% | 44% | 79% | 29% | 34% | 31% | 2 |
| Alsace | 10% | 46% | 44% | 77% | 9% | 57% | 28% | 3 |
| Pays de la Loire | 14% | 44% | 42% | 86% | 43% | 30% | 24% | 8 |
| Centre-Val de Loire | 14% | 49% | 37% | 77% | 7% | 50% | 28% | 1 |
| Burgundy | 11% | 51% | 38% | 68% | 21% | 32% | 44% | 3 |
| Franche-Comté | 10% | 48% | 42% | 72% | 15% | 41% | 38% | 4 |
| Poitou-Charentes | 12% | 50% | 38% | 71% | 37% | 24% | 38% | 10 |
| Limousin | 13% | 52% | 36% | 68% | 30% | 27% | 40% | 5 |
| Aquitaine | 13% | 49% | 37% | 74% | 35% | 29% | 33% | 2 |
| Auvergne | 12% | 53% | 36% | 66% | 25% | 35% | 41% | 2 |
| Rhône-Alpes | 11% | 52% | 37% | 66% | 21% | 32% | 41% | 6 |
| Midi-Pyrénées | 12% | 53% | 35% | 64% | 22% | 31% | 45% | 4 |
| Languedoc-Roussillon | 12% | 54% | 34% | 61% | 23% | 27% | 45% | 5 |
| Provence-Alpes-Côte d'Azur | 9% | 55% | 36% | 57% | 18% | 27% | 45% | 1 |
| Mainland France | 12% | 46% | 42% | 80% | 27% | 34% | 34% | 112 |
WHG, Farmers and Steppe: level 1. Beaker: Bell Beaker share of level 2. Both are computed on the ExploreYourDNA France project averages (n = number of people in each average). Celtic, Germanic and Roman: Karl O. Hogstrom's calculator, his département results grouped into the same historic regions and weighted by their number of individuals. Karl worked on the département averages, a slightly different list of French samples, so a few regions rest on a different number of people (Poitou-Charentes: 4 people in Karl's set). Mainland France, Karl's columns: average of his 48 départements, as above.
- Brittany: the most steppe-rich region of France (47% steppe, 94% Bell Beaker) and by far the most Celtic one (56%; Finistère 63.6%, Côtes-d'Armor 60.8%), with almost no Roman share. Gallo-speaking Ille-et-Vilaine leans Germanic instead.
- Lower Normandy: 44% steppe and one of the highest hunter-gatherer shares (13%). Germanic first (48%), led by Calvados (62.8%): Saxons around Bayeux in the 6th century, then Vikings, both read as Germanic by the calculator.
- Upper Normandy: the second most steppe-rich region (46% steppe, 89% Bell Beaker). Germanic first (44%), with a strong Celtic share (36%) and little Roman ancestry (17%).
- Nord-Pas-de-Calais: 44% steppe, like Belgium next door. The Frankish heartland, Germanic first (39%), with a more Celtic Nord (42.4%) and a more Roman Pas-de-Calais (37.6%).
- Picardy: one person only (Somme): 44% steppe and Germanic first (49%), in line with its northern neighbours.
- Champagne-Ardenne: 42% steppe. One of the most Germanic regions (55%), driven by the Ardennes (71.2%, one person).
- Lorraine: 44% steppe. A mixed picture on two people: Germanic in Moselle (47.2%), more Roman in the Vosges (40.2%).
- Alsace: 44% steppe but one of the lowest hunter-gatherer shares (10%) and a high Roman Italy share (16%). The most Germanic region in Karl's calculator (Bas-Rhin 57.4%), in line with the Alemannic settlement, with almost no Celtic share (9%).
- Pays de la Loire: one of the highest hunter-gatherer shares (14%), no Roman Italy at all, and the second most Celtic region (43%), carried by Loire-Atlantique (54.8%), which belonged to historical Brittany.
- Centre-Val de Loire: one person in the project and two (Indre) in Karl's set: an indication, not a regional picture.
- Burgundy: steppe falls to 38%. Roman first (44%), with a high Germanic share in Nièvre (51%), land of the Burgundian kingdom.
- Franche-Comté: one of the lowest hunter-gatherer shares (10%) and a high Roman Italy share (18%). Germanic and Roman almost equal (41% and 38%), Germanic highest in Doubs.
- Poitou-Charentes: the turning point between north and south: steppe falls to 38% and the extra Neolithic share rises to 22%. Celtic and Roman almost equal in Karl's calculator (37% and 38%), Celtic strongest in Charente-Maritime (45.6%).
- Limousin: 36% steppe and a quarter of extra Neolithic ancestry (25%). Roman first (40%), with a solid Celtic share (30%).
- Aquitaine: two people (Dordogne, Gironde), the Basque Country being left out: 37% steppe, a high hunter-gatherer share (13%) and the most balanced mix in Karl's calculator (35% Celtic, 29% Germanic, 33% Roman).
- Auvergne: 36% steppe and 26% extra Neolithic, already close to the south. Roman first (41%) in Haute-Loire.
- Rhône-Alpes: 52% farmer ancestry and 37% steppe. Roman first (41%), highest in Rhône (47.0%), the land of Lugdunum.
- Midi-Pyrénées: 35% steppe and a quarter of extra Neolithic ancestry (25%). One of the most Roman regions (45%), with Haute-Garonne at 55.4%.
- Languedoc-Roussillon: the least steppe-rich region of mainland France (34%) and the one that kept the most Neolithic ancestry (26% extra Neolithic). Roman first (45%), with Gard at 52.2%; Pyrénées-Orientales has almost no Germanic share (1.4%).
- Provence-Alpes-Côte d'Azur: one person only (Bouches-du-Rhône): the highest farmer share (55%) and the highest Roman Italy share (22%) of the project, and Roman first in Karl's calculator (45.2%).
Read from top to bottom, the table tells the history of France in a few lines: the north-west kept the most of the Bronze Age population that came with the Bell Beakers and became the Gauls, Atlantic and Celtic; the north-east added the most Germanic ancestry; the south kept more of the Neolithic farmers and received more from Rome and the Mediterranean.
Why the Basques are outliers
The Basques are left out of every French average above, and for a good reason: genetically, they are not "a little more southern French", they are a different case. Here are the French Basques (10 individuals) and the Spanish Basques (28 individuals) of the Global25 dataset, run through the same three levels, next to the mainland French average and to Gascony, their northern neighbour (30 individuals).
| WHG | Farmers | Steppe | Extra Neolithic | Roman Italy | Celtic / Germanic / Roman | Distance to the French average | |
|---|---|---|---|---|---|---|---|
| Mainland France (average) | 12% | 46% | 42% | 15% | 5% | 27 / 34 / 34 | – |
| French Basques | 18% | 55% | 26% | 40% | 0% | 41 / 10 / 49 | 0.048 |
| Spanish Basques | 18% | 56% | 26% | 41% | 0% | 53 / 0 / 47 | 0.049 |
| Gascony (Béarn, Bigorre, Chalosse) | 16% | 56% | 29% | 39% | 0% | 38 / 6 / 56 | 0.041 |
Celtic / Germanic / Roman: Karl O. Hogstrom's calculator. Distance: Global25 distance between the population average and the mainland French average. For comparison, Brittany is at 0.024, Languedoc-Roussillon at 0.033 and Provence at 0.037.
1. They are not a "pure Neolithic" people. The Basques carry about 26% steppe ancestry. It arrived in the Bronze Age, as everywhere in Western Europe: in Iberia, steppe-related ancestry spread from about 2500 BCE, and within a few centuries almost all Y chromosomes were replaced by lineages of haplogroup R1b, which is still the dominant paternal lineage of the Basques today (Olalde et al. 2019). Their language survived this turnover, but their genes did not escape it.
2. What makes them different is what came afterwards. Compared with the French, the Basques have less steppe ancestry (26% against 42%), more hunter-gatherer ancestry (18% against 12%) and nearly three times as much Neolithic ancestry left on top of the Bronze Age layer (40% against 15%). They have no Roman Italy share at all, and little or no Germanic share in Karl's calculator (10% for the French Basques, 0% for the Spanish Basques). In other words, they did not receive the later waves that shaped their neighbours: the Iron Age flows from Central Europe, the Roman and later Mediterranean ancestry, the Germanic migrations and, on the Spanish side, the North African ancestry of the medieval period. The large study of Iberian ancient DNA by Olalde et al. (2019) describes present-day Basques as a typical Iron Age population of Iberia that missed the admixture events which later reached the rest of the peninsula.
3. Centuries of isolation added drift. A small population, mountain valleys, a language that set them apart and many marriages within the community let the Basque gene pool drift on its own. This is why no mix of sources fits them well: Karl's calculator rebuilds the French regional samples of the Global25 dataset (Brittany, Nord, Alsace, Occitanie, Provence) almost perfectly, with fit distances under 0.003, but leaves the Basques at 0.012 to 0.013. On the Global25 map, the Basques lie 0.048 to 0.049 from the mainland French average, farther than any region of mainland France.
4. Gascony is the bridge. Béarn, Bigorre and Chalosse sit between the Basques and the rest of France: about 29% steppe and 39% extra Neolithic, at 0.041 from the French average. This is not a surprise: in Caesar's time the Aquitani, who lived between the Pyrenees and the Garonne, spoke a language related to Basque, and the very name of Gascony comes from the Vascones. The Basque profile is the far end of a south-western gradient that fades as one moves north and east.
Corsica is left out for a similar reason: its profile is closer to Italy and Sardinia than to the mainland. Karl's calculator gives the Corsican samples of the Global25 dataset about 70% Roman Empire, and the Corsican average lies 0.071 from the mainland French average, even farther than the Basques.
How to read these results
- The sources are reference groups of ancient individuals, not literal ancestors. A share means "this source helps rebuild the profile", not "this many of your ancestors came from that people".
- The deep models fit less closely than Karl's calculator (their sources are thousands of years older and fewer genomes are available), so read the differences between regions rather than the exact percentages.
- Karl's calculator has no Iberian source, so in the far south-west and in Roussillon "Celtic" probably stands for western European Iron Age ancestry in general.
- 25 of the 48 départements in Karl's set rest on a single individual. The averages built on 5 to 11 individuals (Finistère, Manche, Pas-de-Calais, Seine-Maritime, Calvados, Nord) are the most solid. Île-de-France has no reference sample yet.
- In the project, Picardy, Centre-Val de Loire and Provence-Alpes-Côte d'Azur rest on one person, and Alsace, Aquitaine, Auvergne, Burgundy, Champagne-Ardenne and Lorraine on two or three. The averages built on 8 to 17 people (Brittany, Lower and Upper Normandy, Nord-Pas-de-Calais, Poitou-Charentes, Pays de la Loire) are the most solid.
Global25 coordinates used in this article
The 20 regional averages of the ExploreYourDNA France project and their mainland average, the sources of levels 1 and 2, the Iron Age Gauls, the Basques and Gascony. They can be pasted directly into the Vahaduo tool or into our calculators.
France_Brittany_(N=17),0.131098,0.136439,0.060628,0.041420,0.038813,0.014847,0.003511,0.004276,0.005318,0.007504,-0.005426,0.005104,-0.015295,-0.013900,0.019751,0.005389,-0.006044,0.001274,0.002063,0.003428,0.004477,0.003710,-0.000029,0.010405,0.001078
France_Lower_Normandy_(N=13),0.128970,0.141080,0.056858,0.031828,0.040836,0.011220,0.001555,0.004509,0.009267,0.009925,-0.003385,0.005499,-0.013643,-0.010544,0.015180,0.001897,-0.005576,0.002738,0.002321,0.002867,0.005846,0.003158,-0.003413,0.008286,-0.001354
France_Upper_Normandy_(N=10),0.126571,0.139229,0.055512,0.034561,0.040623,0.013108,0.002115,0.006254,0.007670,0.008255,-0.004011,0.005125,-0.009395,-0.008285,0.017046,0.005184,-0.005541,0.002572,0.000415,-0.000250,0.002471,0.001657,-0.001233,0.012050,-0.001425
France_Nord-Pas-de-Calais_(N=13),0.126606,0.139596,0.053116,0.029567,0.039487,0.011692,0.003706,0.005024,0.009487,0.009476,-0.002748,0.005510,-0.012991,-0.008903,0.013509,-0.001316,-0.006931,0.003898,0.004747,-0.002530,0.002515,0.002207,0.000019,0.008147,-0.000654
France_Picardy_(N=1),0.129758,0.141159,0.060339,0.030039,0.039084,0.009761,0.005170,0.008077,0.007772,0.009659,-0.003248,0.004346,-0.013379,-0.010046,0.013301,0.007955,-0.003651,-0.001140,0.002891,-0.001501,0.002870,0.012489,-0.004314,0.009881,-0.005029
France_Champagne-Ardenne_(N=2),0.129758,0.143698,0.054305,0.019865,0.036007,0.012271,0.002350,0.004615,0.008795,0.013758,-0.003816,0.004346,-0.011595,-0.008464,0.010587,0.005834,0.000847,-0.001963,0.009176,-0.000687,0.002683,-0.000618,0.001048,0.009640,0.000239
France_Lorraine_(N=2),0.123498,0.138620,0.046952,0.025840,0.034468,0.008785,0.007755,0.006808,0.011454,0.011664,-0.002923,0.006968,-0.012934,-0.011973,0.013912,0.010873,-0.002868,0.004117,0.004525,-0.000063,0.001185,-0.000741,-0.004129,0.009640,0.001197
France_Alsace_(N=3),0.127102,0.141836,0.051917,0.016258,0.037751,0.014316,0.003838,-0.000308,-0.000887,0.006621,-0.003681,0.000100,-0.011942,-0.005734,0.008641,-0.001591,-0.006823,0.002153,0.003603,0.003293,0.006738,0.002390,-0.002588,0.007953,-0.002395
France_Pays_de_la_Loire_(N=8),0.130754,0.137731,0.055814,0.032219,0.043700,0.011295,0.003143,0.005048,0.009357,0.014556,-0.004141,0.007531,-0.015684,-0.011388,0.014658,0.006281,-0.003080,0.000887,0.000078,0.000735,0.004711,0.002674,-0.001633,0.003555,-0.000284
France_Centre-Val_de_Loire_(N=1),0.120652,0.144205,0.056945,0.019703,0.048932,0.012271,0.003995,0.006923,0.016566,0.020410,-0.002761,0.003297,-0.015312,-0.013762,0.011265,0.006232,-0.005215,-0.006208,0.006913,-0.002876,-0.000624,-0.000495,-0.003451,0.002771,-0.011975
France_Burgundy_(N=3),0.127482,0.141835,0.045506,0.014966,0.039597,0.005299,0.001488,-0.000230,0.014658,0.022233,-0.004060,0.004746,-0.016997,-0.008441,0.006153,0.002829,-0.001521,0.002280,0.005656,-0.003460,0.005823,0.001566,-0.003533,0.007230,0.001597
France_Franche-Comté_(N=4),0.124067,0.144713,0.046386,0.015423,0.037161,0.008436,0.001939,0.004904,0.005420,0.012984,-0.004019,0.004721,-0.012971,-0.006158,0.009874,-0.004673,-0.010463,0.002217,0.004651,0.001032,0.002932,0.002504,0.001017,0.007169,-0.000868
France_Poitou-Charentes_(N=10),0.126799,0.146541,0.050119,0.017442,0.044254,0.003904,-0.001434,0.003300,0.013376,0.022579,-0.005765,0.007104,-0.013796,-0.012262,0.011563,0.001485,-0.005685,0.001495,-0.000138,-0.000250,0.002308,0.004736,-0.001984,0.005049,-0.001162
France_Limousin_(N=5),0.126344,0.147455,0.051213,0.013178,0.044131,0.005355,0.003572,0.006553,0.017794,0.024711,-0.005131,0.006354,-0.013082,-0.012689,0.009880,-0.000159,-0.000626,0.003471,0.002438,-0.003377,0.002845,-0.000544,-0.000468,0.001542,-0.000814
France_Aquitaine_(N=2),0.126913,0.146744,0.054683,0.019380,0.042931,0.005160,0.002468,0.002077,0.014419,0.022233,-0.005278,0.009517,-0.023637,-0.011010,0.014251,0.000729,-0.006454,0.002914,0.001131,0.000562,0.003993,0.000186,0.000801,-0.000542,0.002574
France_Auvergne_(N=2),0.129190,0.149790,0.050534,0.010336,0.043393,0.008228,0.004465,0.004154,0.016567,0.025968,-0.001137,0.007793,-0.018434,-0.008464,0.002985,0.002917,-0.001434,0.002090,0.004399,-0.000313,0.003681,-0.002041,-0.003142,0.008374,-0.003533
France_Rhône-Alpes_(N=6),0.124826,0.142343,0.045192,0.011843,0.043341,0.003858,-0.000235,0.003461,0.015101,0.022324,-0.002815,0.007518,-0.012686,-0.009702,0.006243,0.006895,0.004129,0.001668,0.002116,-0.000125,0.001539,0.005070,-0.003574,0.005663,-0.000659
France_Midi-Pyrénées_(N=4),0.127482,0.144713,0.047800,0.009771,0.041931,0.003904,-0.000176,0.001154,0.014419,0.026743,-0.002152,0.006332,-0.015869,-0.012317,0.003088,0.008519,0.012615,-0.002407,0.000377,-0.000907,0.004399,0.001948,-0.002650,0.001838,-0.004520
France_Languedoc-Roussillon_(N=5),0.129986,0.146440,0.044802,0.006008,0.039023,0.000223,0.000282,0.004061,0.022089,0.028064,-0.002631,0.006774,-0.014301,-0.009744,0.010939,-0.004057,-0.009622,0.003015,0.000176,-0.003377,0.006189,0.002819,-0.001972,-0.001663,0.001581
France_Provence-Alpes-Côte_d'Azur_(N=1),0.125205,0.141159,0.039975,0.000323,0.043700,-0.004741,0.006110,0.005077,0.011453,0.021504,0.001624,0.008393,-0.015312,-0.007432,0.005700,0.002254,0.002477,0.002407,0.004777,-0.005628,0.000000,0.001978,0.003081,0.000361,-0.004191
France_Mainland_project_average_(N=112),0.127909,0.141467,0.053157,0.025379,0.040821,0.009430,0.002235,0.004325,0.010433,0.014703,-0.003903,0.005850,-0.013893,-0.010567,0.013068,0.002792,-0.004208,0.001965,0.002295,0.000161,0.003723,0.002653,-0.001464,0.006894,-0.000716
Source_WHG_Mesolithic_France_Luxembourg_Germany_England,0.123775,0.111418,0.192752,0.193903,0.155862,0.058360,0.015847,0.034878,0.090049,0.011064,-0.015807,-0.015419,0.018910,-0.001679,0.057887,0.058408,-0.001885,0.010204,-0.006931,0.056809,0.106815,0.013584,-0.049433,-0.168612,0.019930
Source_Anatolian_farmers_Barcin,0.118629,0.182908,0.004232,-0.101494,0.054626,-0.046420,-0.006110,-0.006615,0.038587,0.083160,0.008949,0.012681,-0.023778,0.001927,-0.044350,-0.009134,0.020680,0.000211,0.012018,-0.011186,-0.012117,0.006712,-0.006539,-0.003601,-0.004743
Source_Steppe_Yamnaya_Samara_Kalmykia,0.122726,0.088913,0.041221,0.111932,-0.028384,0.044174,0.004213,-0.002769,-0.054980,-0.073464,-0.000275,-0.000768,-0.001280,-0.021904,0.035503,0.011199,-0.006005,-0.001735,-0.002943,0.010344,-0.005290,0.001234,0.009453,0.020227,-0.003394
Source_Neolithic_France,0.125727,0.173923,0.043463,-0.051133,0.080344,-0.029636,-0.004315,-0.002067,0.060985,0.094021,0.001865,0.015268,-0.031345,-0.014183,-0.015121,0.001342,0.014934,0.002764,0.005396,-0.005850,0.003962,0.003206,-0.012227,-0.024895,-0.000276
Source_Bell_Beaker_Germany_Czechia_Netherlands,0.126891,0.130579,0.057174,0.048994,0.032150,0.016419,0.002371,0.003745,0.001794,0.001490,-0.001663,0.004830,-0.010833,-0.013463,0.015489,0.008761,-0.000736,0.000553,0.001800,0.004247,0.004941,0.003021,-0.001162,0.000465,-0.000476
Source_Roman_Italy_Imperial,0.109017,0.149650,-0.021024,-0.055215,0.005753,-0.019693,-0.000261,-0.005557,-0.002449,0.021038,0.003532,0.002785,-0.005864,-0.000807,-0.009414,-0.001727,0.004745,0.001126,0.002140,-0.004151,-0.002665,0.003084,-0.001362,0.000592,0.000020
Iron_Age_Gaul_average,0.127380,0.142156,0.056437,0.027556,0.045030,0.008773,0.001397,0.004088,0.014045,0.018995,-0.002766,0.007021,-0.015061,-0.010647,0.010733,0.000725,-0.005397,0.001485,0.002333,0.000538,0.004851,0.003543,-0.003865,-0.001071,-0.000921
Basque_French_average,0.128051,0.152025,0.055173,0.012823,0.056410,0.002510,-0.001410,0.003323,0.030597,0.041204,-0.009272,0.010341,-0.020976,-0.014024,0.013219,-0.001936,-0.011917,0.003028,-0.000717,-0.004414,0.010157,0.002485,-0.008640,-0.009170,0.000072
Basque_Spanish_average,0.126425,0.148739,0.055679,0.008790,0.055450,0.000249,-0.001754,0.000025,0.029539,0.042923,-0.005214,0.010801,-0.024986,-0.019493,0.015807,0.002614,-0.005630,0.003172,-0.002375,-0.001791,0.008819,0.002204,-0.006479,-0.008654,0.001150
Gascony_Bearn_Bigorre_Chalosse_average,0.127861,0.146643,0.052583,0.007504,0.052502,0.001367,-0.000964,-0.000038,0.024843,0.039272,-0.004883,0.009022,-0.020272,-0.014519,0.011333,0.001529,-0.004903,0.001047,-0.001136,-0.002818,0.005416,0.001698,-0.005875,-0.007246,-0.000128
Try it with your own DNA. Paste your G25 coordinates into The Migration Era Calculator to see your own Celtic, Roman and Germanic mix. For a full picture of French ancestry, our France Profonde report compares your DNA with the regions of France period by period, from the Neolithic to today.
Level 3: The Migration Era Calculator by Karl O. Hogstrom (his PDF report also includes Corsica). Levels 1 and 2: ExploreYourDNA models of the ExploreYourDNA France project averages, with Global25 coordinates of published ancient genomes. Basque, Gascon, Corsican and English samples: Global25 dataset. Further reading: Brunel et al. 2020 (PNAS, ancient genomes from present-day France), Olalde et al. 2018 (Nature, the Beaker phenomenon), Olalde et al. 2019 (Science, the genomic history of the Iberian Peninsula). Base map: Esri, World Light Gray Canvas.