
Independent research | Ancient DNA
The Redundant Hypothesis
What ancient DNA reveals about the origins of the Bulgarians
Hero image: AI generated illustration of a Late Antique settlement on the lower Danube. It is not a reconstruction of a documented site and is not a portrait of any real person.
Independent research by Ilian Yordanov. This article is published as written by its author. Independent research represents the views of its authors and does not necessarily reflect the editorial position of ExploreYourDNA.
If by the 5th century the Balkans were already inhabited by a population that genetically resembles modern Bulgarians, then the Slavic settlement of the 6th century is not needed to explain our present-day profile. This article tests exactly that — with numbers anyone can reproduce.
1. What the debate is about
In recent years, several ancient DNA studies from the Balkans have appeared. Their general picture is this: the Iron Age population looks more southern than today's Balkan peoples, and somewhere between Antiquity and the Middle Ages a northward shift occurs. The question is when and why.
The mainstream answer: in the 6th century a massive Slavic settlement arrives, bringing the northern component. This thesis underpins Gretzinger et al. (2025) and Olalde et al.
The alternative we test here is different: the northern component arrived centuries earlier, through long-standing exchange with the Pontic steppes, and by the 4th–5th centuries the population was already what we know today.
The difference is testable. If we find pre-6th-century samples that already look like modern Bulgarians, and that are not better explained by adding a Slavic component — then the Slavic hypothesis is not needed to explain the present-day profile.
2. How it is calculated
The method is simple in concept. Each ancient sample is described by 25 numbers — coordinates summarising its genetic position relative to all others (the system is called G25). Two samples with similar coordinates are genetically similar.
Then we ask: can this sample be represented as a mixture of several known populations? For example, "60% from population A plus 40% from population B". The computer finds the combination giving the closest match and reports how much remains unexplained — this number is called the residual.
Key for reading below: a small residual means the model works. A large residual means the sample is missing a source not included — and then the percentages should not be read literally.
We use four sources:
- Balkan Iron Age — average of seven samples (Albania, Croatia, Slovenia, Macedonia, Bulgaria)
- Northern Scythians — nine samples from the Ukrainian steppe, published by Andreeva
- Anatolian — Turkey_IA
- East Eurasian — an Avar elite specimen from Hungary
And one control that is the centrepiece of the whole test: in every model we also offer Gródek — a real Slavic population from Poland, dated 777 AD. If the northern component in the Balkan samples comes from the Slavs, Gródek should receive a substantial share.
3. First result: the 4th–5th century population
The necropolis at Han Krum (later the Aula of Khan Omurtag, abbreviated AKO) is dated 350–489 AD — a century and a half before the supposed Slavic settlement. Sixteen individuals.
| Model | Balkan | Scythian | Anatolian | Gródek | Residual |
|---|---|---|---|---|---|
| Three sources | 29% | 55% | 16% | — | 0.010 |
| With Gródek offered | 29% | 55% | 16% | 0% | 0.010 |
The Slavic proxy receives zero. Not because we excluded it — it was offered a place in the model and it declines, because it does not improve the fit at all.
And the resemblance to modern Bulgarians?
We measure the distance from the average modern Bulgarian to each of the tested ancient populations:
| Population | Distance |
|---|---|
| AKO (350–489 AD) | 0.026 |
| Aquae Calidae (same period, Burgas region) | 0.045 |
| Balkan Iron Age (average) | 0.049 |
| Gródek (Slavs, 777 AD) | 0.072 |
| Kapitan Andreevo (Bulgarian Iron Age) | 0.080 |
| Wielbark (Poland, 1st–2nd c. AD) | 0.095 |
AKO is the closest ancient population to modern Bulgarians of everything we have tested — closer even than the Balkan Iron Age population. One individual, I41201, is 0.016 from the average modern Bulgarian, which is within the range of differences between individual people today.
The same, in one picture
The chart below places all groups in a common space. The horizontal axis captures 62% of the total genetic variation and runs from the steppe/northern (left) to the southern/Balkan (right). The closer two points are, the more genetically similar they are.
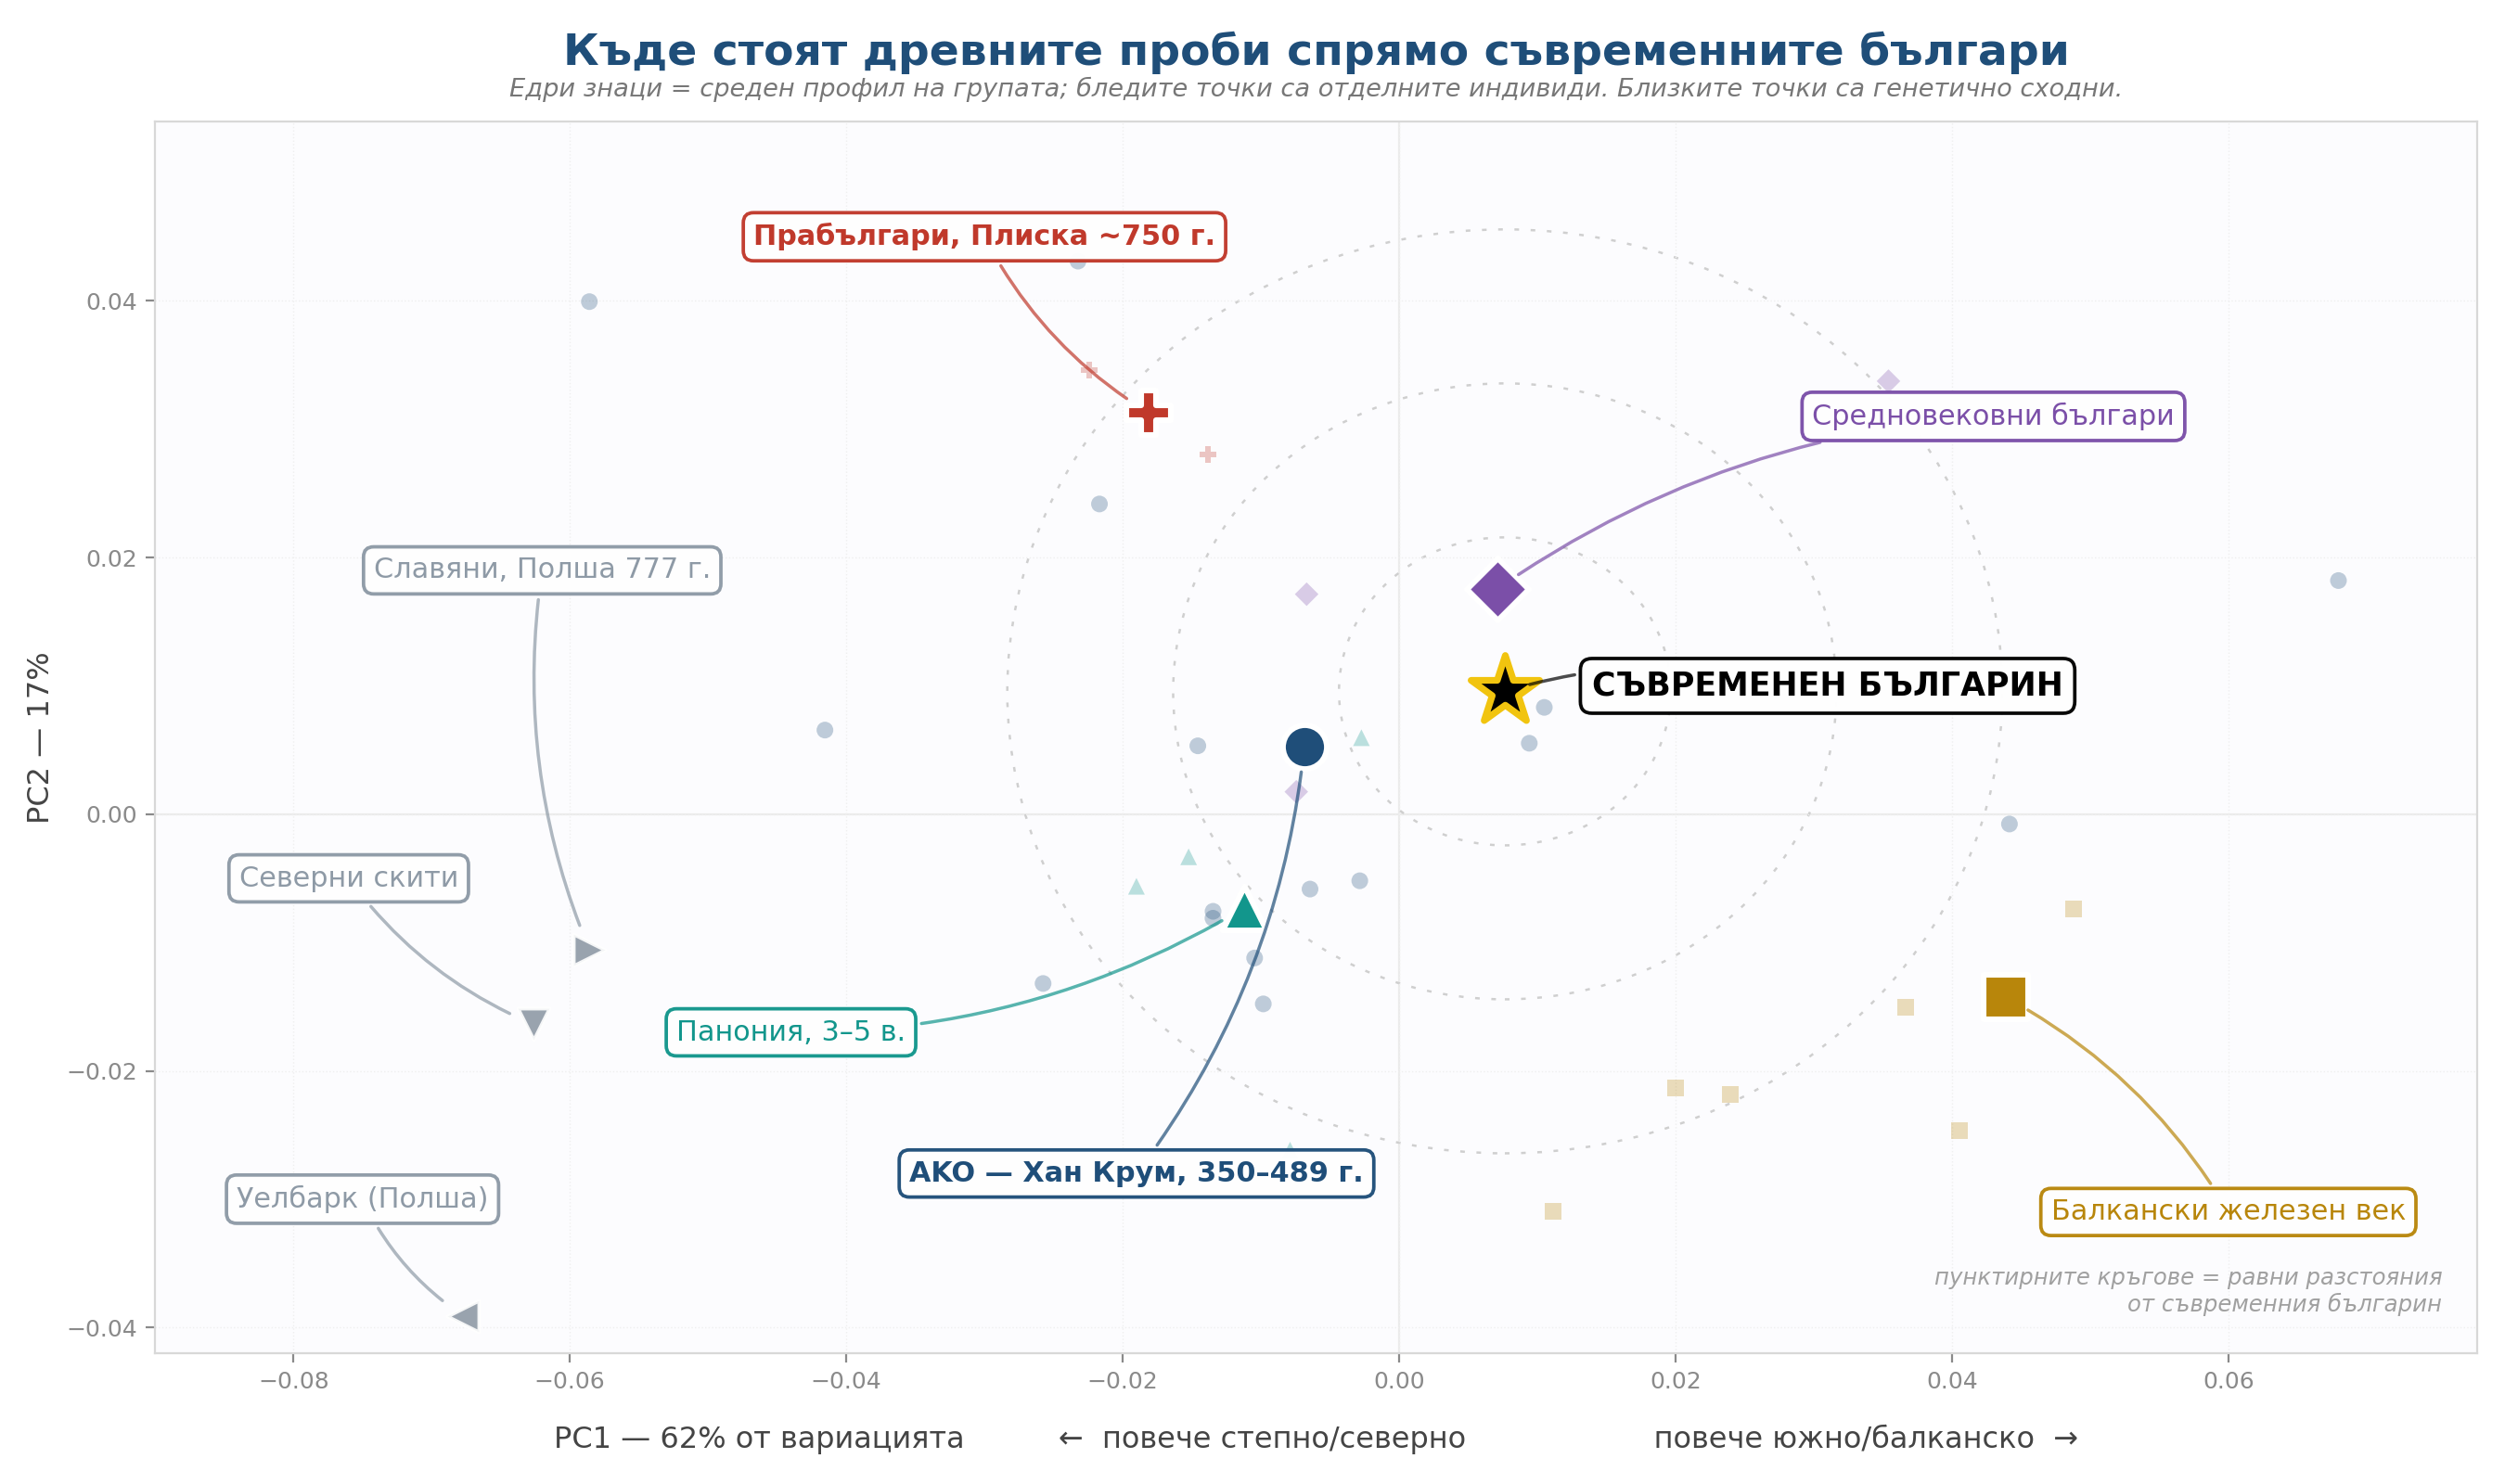
Four things are immediately visible: the Balkan Iron Age population (yellow) stands to the right, far from the modern Bulgarian; AKO and the Pannonian samples occupy the middle; the medieval Bulgarians are practically on the star; and the proto-Bulgarians from Pliska are upper-left — the most distant from the present-day population among all local groups.
4. Second result: the same is seen in Pannonia
One necropolis is not proof. So we apply the same model to samples from Hungary — 500 kilometres away, a different archaeological tradition, a different research team.
| Sample | Date | Balkan | Scythian | Anat. | Gródek | → AKO |
|---|---|---|---|---|---|---|
| I20802 | 200s AD | 37% | 49% | 14% | 0% | 0.021 |
| A181021 | ~400 AD | 49% | 51% | 0% | 0% | 0.040 |
| A181019 | 450 AD | 35% | 57% | 7% | 0% | 0.028 |
| A181020 | 450 AD | 35% | 61% | 4% | 0% | 0.031 |
| AKO | 350–489 | 29% | 55% | 16% | 0% | — |
The same profile, the same zero Slavic share. The 3rd-century sample (I20802) is 0.021 from AKO — closer than some individuals within AKO are to each other.
When did this component appear?
There is a control sample from the same region but from the Iron Age — I18259, from the Srem group, dated 360 BC. It gives 92% Balkan and only 8% Scythian.
The Scythian component is absent in the 4th century BC and present by the 3rd century AD. The arrival window is bracketed: somewhere between these two dates, not in the 6th century AD.
5. Where the northern component comes from
Not from the north in the narrow sense. We tested the Wielbark culture from Poland — nine samples from the 9th to the 161st century AD. They are genetically Scandinavian: seven of nine model as 89–100% Scandinavian. Offered as a source for AKO, Wielbark receives between zero and eight percent.
The best fit comes from the western Scythians of the Ukrainian steppe. And here a detail appears that says much about the nature of the process.
The corridor was two-way
The Scythian sample is highly heterogeneous. Nine of fifteen individuals are strongly northern. But six are Balkan in profile — up to 78% in individual samples.
These six cannot be the source of the northern component in the Balkans — they themselves are predominantly Balkan. They are evidence of the opposite direction: Balkan population in the steppe during the 5th–4th centuries BC.
Even earlier: a Cimmerian sample from Kartal-3 at the Danube mouth, dated 897 BC, comes out 76% Balkan. Exchange with the steppe goes back at least to the 9th century BC.
And the Slavs themselves?
Here there is a twist worth noting. Gródek — the Slavic population from Poland, 777 AD — models as 0% Balkan, 97.5% northern Scythian. Its distance to the northern Scythians is 0.028, the smallest between any two tested groups.
So the 8th-century Slavs derive almost entirely from the same Pontic-steppe reservoir from which the northern component in AKO comes. The difference is that in AKO it is already mixed with local Balkan and Anatolian population, while in Gródek it is not.
The two populations are cousins from a common source, separated by centuries. This is why Gródek adds nothing to AKO: the contribution it would bring was already there for centuries.
6. The chain to the present day
It remains to check whether the line closes.
| Population | Period | Balkan | Scythian | Anat. | → modern Bulg. |
|---|---|---|---|---|---|
| AKO | 350–489 | 32% | 52% | 15% | 0.026 |
| I41955 (Gradishte) | Late Antiquity | 35% | 53% | 10% | 0.038 |
| Medieval (n=3) | 10th–11th c. | 23% | 49% | 28% | 0.015 |
| Modern Bulgarian | today | 36% | 45% | 19% | — |
The modern Bulgarian is obtained as approximately 83% AKO-type population plus approximately 17% from the southern Bulgarian Iron Age population. Both components are local — not a single external source is needed after the 6th century.
The same holds for the medieval samples: they model as 84% AKO plus 16% southern Bulgarian component. If we instead use the medieval samples themselves as the starting point, the fit becomes even better (residual 0.013) — simply because they already contain this mixture, actually measured rather than assembled by us.
The medieval samples include one from Macedonia (I2530) which alone gives 32/56/12 — practically identical to AKO from half a millennium earlier and from the other side of the country.
Also notable: the modern Bulgarian is slightly more southern than AKO — with more Anatolian and less Scythian share. AKO is a northern-frontier sample; today's population includes the southern regions too, which probably explains the difference.
7. The proto-Bulgarians
Recently, the numbers of several samples attributed to proto-Bulgarian burials from Pliska, around 750 AD, became known. Their metadata have not yet been officially published — the dating and site come from informal communications by the researchers. Everything in this section is therefore preliminary.
The two samples (I41083, I41084) do indeed differ from the local population. But the model for them does not work well: the residual is around 0.030, versus 0.010 for AKO. This means these individuals are missing a source we have not included.
| Sample | Balkan | Scythian | Anat. | E. Eurasian | Residual |
|---|---|---|---|---|---|
| I41083 | 16% | 58% | 22% | 5% | 0.033 |
| I41084 | 9% | 61% | 22% | 7% | 0.031 |
| CSK013 (Avar, Vienna) | 14% | 58% | 23% | 5% | 0.030 |
| AKO — for comparison | 32% | 52% | 15% | 1% | 0.008 |
Adding an East Eurasian source reduces the residual — from 0.038 to 0.030 — and attributes around 5–7% eastern component to the proto-Bulgarian samples. But the residual does not close. Part of these individuals' profile remains unexplained with current references and data. The samples have very low coverage and this could well be noise.
The honest description for now (until more and more reliable samples emerge) is: the samples identified as proto-Bulgarian are close to modern Bulgarians and show a small component absent from the local population, which the model does not fully explain. The two samples have 50–58% genome coverage, which itself introduces noise.
Whatever it is — it is not passed on
This is the more important observation and does not depend on the exact nature of the signal. The same model applied to later populations:
| Population | East Eurasian share |
|---|---|
| Proto-Bulgarian samples, Pliska | 5–7% |
| Avar cluster (Vienna, Hungary) | 2–11% |
| AKO (350–489 AD) | 1% |
| Medieval Bulgarians | 0% |
| Modern Bulgarians | 0% |
The proto-Bulgarian centroid is 0.041 from AKO, 0.041 from the medieval samples, and 0.042 from the modern Bulgarian. It does not lie on the line from the ancient to the present-day population — it stands slightly aside from it.
The proto-Bulgarians are not predecessors of the modern population in a straight line. Whatever they brought was diluted to undetectability even before the Middle Ages.
8. What follows from all this
Follows
- By the 3rd–5th century, the population of Moesia and Pannonia already carried a 49–61% component of Pontic-steppe origin (already a mixed Balkan, local and northern ancestry).
- This component is absent in the Iron Age in the same locations — the control sample from 360 BC gives 8%. We have no samples from Moesia and Dacia and do not know what the population there was. Logically it was more mixed than western Balkans and Pannonia.
- A Slavic population from the 8th century adds nothing to the models for these samples — it receives zero in every one of them.
- The modern Bulgarian is derived from AKO and the medieval samples without any additional source.
- The Slavic settlement of the 6th century is not needed to explain the present-day genetic profile of the Bulgarians.
Does NOT follow
- That there was no Slavic settlement at all. These data show that it is not necessary for the explanation — not that it did not happen. A Slavic-speaking population could have arrived and left a weak genetic trace on an already numerous local population.
- That the language question is settled. Genes and language move independently; Hungarian and Turkish are examples of complete language replacement with minimal genetic input. Genetics does not prove the origin of a language — but it can show which pathways were open. See the next section.
- The two proto-Bulgarian samples are incomplete and insufficient to clarify whether a new population arrived among the AKO population. And if it did arrive, it left no traces. Nothing new of significance arrived after the 5th–6th century.
- That AKO represents the entire population of the country. This is one necropolis in northeastern Bulgaria.
9. Language: what the corridor opens up
The standard explanation for the Bulgarian language is simple: the Slavs arrive in the 6th century and bring it with them. It rests on one silent assumption — that people moved in only one direction, from north to south.
The data here show something else. The corridor was two-way and active for centuries. A Cimmerian at the Danube mouth in 897 BC — 76% Balkan profile. Six of fifteen Scythians from the Ukrainian steppe — Balkan, up to 78%. The Pannonian samples from the 3rd–5th centuries — the same mixture as AKO. And the Slavs from Poland in 777 AD derive almost entirely from the same Pontic-steppe reservoir.
Balkan population was present in the steppe and in Pannonia centuries before the supposed Slavic settlement. The south-to-north route was just as open as the opposite one.
From this follows a possibility that is usually not even discussed: since people moved in both directions, the direction of language is not predetermined by demography. The hypothesis that the language — or part of its features — originates from the Balkans and was carried northward by that same flow is no longer demographically absurd. Until recently it appeared that such a flow did not exist at all. It turns out it did.
Here is the moment to say the other thing as well. Linguistics today leans in the opposite direction — Slavic languages are closely related to Baltic ones, the reconstructed Proto-Slavic vocabulary describes a more northerly natural environment, and our river names are Thracian and Latin passed through Slavic phonetics. These arguments are not overturned by genetics.
Therefore the precise formulation is this: genetics shows that the south-to-north route was open. Whether language passed along it is a separate question, settled with linguistic evidence. But the possibility itself now sits on the table where it was not before.
10. What we do not know
- Between 489 AD (end of AKO) and 750 AD (Pliska) there is not a single sample. This is exactly the period in which the mainstream places the Slavic settlement — and it is a blind spot.
- We do not know whether the steppe influx arrived all at once or accumulated over centuries. The two scenarios give the same end result and cannot be distinguished with the available methods.
- We have not ourselves measured the date of admixture — the window 360 BC – 200 AD comes from a control sample, not from a calculation.
11. Limitations of the method
The reader should know where this work is weaker than a peer-reviewed study.
- The method used (NNLS on G25 coordinates) is an approximation, not a formal qpAdm. It gives percentages without standard errors or confidence intervals. Bootstrap testing shows the Scythian share for AKO is stable (54%, interval 46–59%), but the Balkan share is far more variable, and for the proto-Bulgarian samples all intervals are wide.
- Sample sizes are small: AKO n=16, Scythians n=15, Wielbark n=9, medieval n=3, proto-Bulgarians n=2. The Hungarian samples are single individuals.
- The metadata for the Pliska samples have not been officially published.
- The main evidence of the opposing camp — the shared DNA segment (IBD) analysis in Gretzinger et al. — is not addressed here. It is a fundamentally stronger tool than proportion modelling and deserves a separate examination.
- During this work one earlier estimate was withdrawn: modelling via Bronze Age sources gave "62% Balkan origin for AKO", but on checking it turned out that this component does not distinguish the Balkans from Poland — a Slavic sample from 777 AD received a higher value than the Bulgarian Iron Age samples. The estimate was dropped.
12. Appendix: data and reproducibility
All samples used are published in accessible databases (AADR, the publications of Gnecchi-Ruscone et al. 2024, Andreeva et al., Olalde et al., Stamov & Chobanov preprint). G25 coordinates are from the standard datasets.
Samples used by group:
AKO (350–489 AD): I40357, I40926, I40932, I41140, I41198–I41206, I41230–I41236
Aquae Calidae: I40570–I40575, I41121–I41123, I41134–I41151, I41193–I41195
Western Scythians (Andreeva): UKR000, UKR002, UKR006, UKR007, UKR035AB, UKR039, UKR042, UKR043, UKR044, UKR089, UKR090, UKR091, UKR095, UKR111, UKR169
Hungary: I18259 (360 BC), I20802, A181019, A181020, A181021, I18185, I16750, KPM-14, I16759, SZ1, RKF243, RKF268, RKF051, LEO079, SZF-181, HH-22, I16753
Wielbark (Weklice): R10618, R10620, R10625, R10626, R10631, R10633, R10634, R10636, R11391
Gródek (777 AD): GRK004, GRK008–GRK015
Medieval: I10548, I17980, I2530 (Macedonia)
Pliska (preliminary): I41083, I41084
Austria (Avars): CSK013, CSK040
The method is non-negative least squares regression (NNLS) on the 25 G25 coordinates, with coefficients normalised to sum to 1. The residual is the Euclidean norm of the difference between observed coordinates and model. Scripts can be provided on request.
Anyone with the same coordinates can reproduce the calculations and verify the numbers. That is also the invitation to the reader: do not accept the conclusions — check them.