
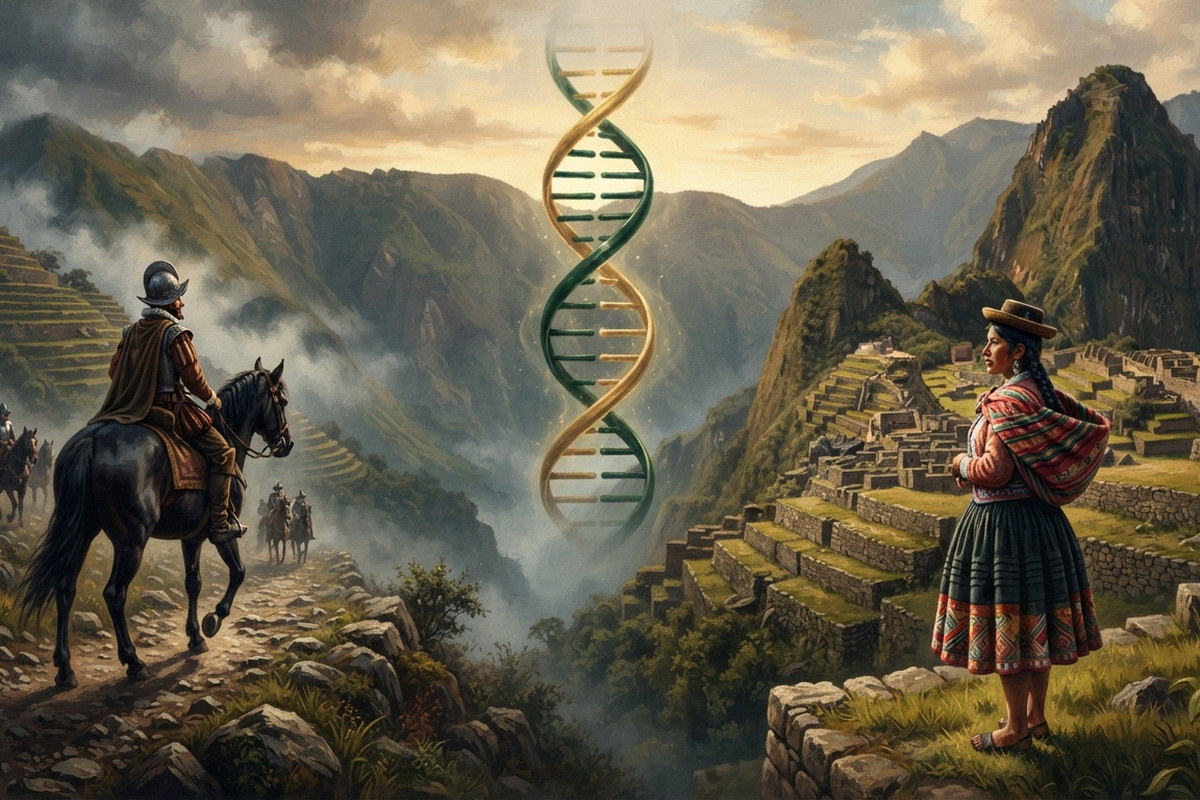
The Spanish and Portuguese who crossed the Atlantic after 1492 were, in overwhelming majority, men. What they left behind in the genome of Latin America is not one history but two, depending on which parent you trace. Follow the paternal line, the Y-chromosome, and in most of the continent it now reads European. Follow the maternal line, mitochondrial DNA, and it almost everywhere still reads Native American. That asymmetry has been documented since the year 2000 in population after population, and it is the direct genetic fingerprint of a colonization carried out by soldiers, merchants and encomenderos who married or took local women, not by families who arrived together. But the size of the shift is not the same everywhere, and Peru and Bolivia are the two countries where it bends hardest. In parts of the Bolivian and Peruvian Andes, the paternal line never flipped at all.
Two passports in one genome
The clearest textbook case is Antioquia, in the Colombian Andes. A population founded during the sixteenth and seventeenth centuries by Spanish settlers and the Amerindian women of the region was later analyzed for both uniparental markers, and the result is stark: Y-chromosome lineages came out at roughly 94 percent European, 5 percent African and 1 percent Amerindian, while mitochondrial DNA in the same population came out at roughly 90 percent Amerindian, 8 percent African and 2 percent European. One parent's line survived almost intact. The other was almost entirely replaced. The same pattern, European fathers and Native or African mothers, has since been confirmed across dozens of Latin American populations using genome wide SNP data, and it holds not only within populations but between them: Native American ancestry is consistently enriched on the X chromosome and in mtDNA relative to the rest of the genome, continent wide.
Mexico shows the same signature from the maternal side alone. A survey of Mexican Mestizo mitochondrial lineages found the maternal pool to be about 89 percent Native American, 5 percent European and 4 percent African, a composition that has changed little across regions with very different colonial histories. The founding mothers of modern Mexico, like the founding mothers of modern Colombia, were mostly Indigenous.
Data and method
This article works differently from most of the site's Global25 pieces. Y-DNA haplogroups and mtDNA haplogroups are uniparental markers, inherited as single unrecombined blocks down one parental line only, and they are reported directly as frequencies in forensic and population genetics papers rather than reconstructed from autosomal coordinates. There is no G25 coordinate system for a haplogroup and no NNLS model to run. What follows is a synthesis of published frequency data from peer reviewed studies, each cited individually, rather than a coordinate based reconstruction. Two honest notes before any number is used. Sample sizes vary enormously across the studies compared here, from a few dozen individuals in some Andean ethnic samples to several hundred in national forensic panels, and small samples carry real sampling noise. And a haplogroup frequency is not the same measurement as an autosomal ancestry percentage: a man can carry a Native American Y-chromosome and still have a majority European autosomal genome, a distinction addressed directly in the limitations section below.
The commercial gradient
Before reaching the Andes, the general continental pattern has its own internal geography. R1b-DF27 is the branch of the European R1b lineage most specific to Iberia, present in about 49 percent of Iberian Y-chromosomes today and almost absent elsewhere in Europe. Its frequency in Latin America, drawn from 1000 Genomes Project data, falls steeply and unevenly as one moves from the Caribbean and northern South America toward the Pacific: 40 percent in Colombia, 36 percent in Puerto Rico, 10 percent in Mexico, and just 8 percent in Peru.
R1b-DF27 frequency by country, 1000 Genomes Project, as reported in Sole-Morata et al. 2017. A separate five country forensic study of Panama, Nicaragua, El Salvador, Guatemala and Colombia found the same haplogroup averaging 28 to 35 percent, highest in Colombia and lowest in El Salvador, tracking the colonial era Spanish trade routes.
Colombia and Puerto Rico sit on the direct line of sixteenth century Spanish transatlantic trade and administration. Peru, despite hosting the seat of the Viceroyalty of Peru and one of the two great silver economies of the empire, ends up at the bottom of this particular ranking. The explanation is not that fewer Spaniards went to Peru. It is that Peru already held, at contact, one of the largest and most densely settled Indigenous populations anywhere in the Americas, organized under the Inca state and its Andean predecessors. A comparatively small number of colonizers arriving into a demographically overwhelming Indigenous population produces a very different genetic outcome than the same number of colonizers arriving into a population that was small, scattered or catastrophically reduced by disease before intensive settlement began.
Where the rule bends
That demographic logic is visible directly in Y-chromosome data from Peru and Bolivia, and it produces the widest range of any region on the continent. At one end, Colombia's Antioquia sample carries essentially no Native paternal lineage left, about 1 percent. At the other end, Aymara communities in the Bolivian Altiplano carry essentially no European paternal lineage at all.
Share of Native American Y-chromosome haplogroups (overwhelmingly haplogroup Q) by population sample. Blue marks lowland or settler heavy populations, orange marks Andean or Amazonian populations with a demographically dominant precolonial base.
Between those extremes sits most of the interesting variation. A national Bolivian forensic sample of 226 men drawn from five departments, including the more European leaning lowlands of Santa Cruz, Beni and Pando, averaged 65 percent European and 29 percent Native American Y-chromosome ancestry. But when the same kind of study samples the Aymara and Quechua populations of the Andean Altiplano specifically rather than the country as a whole, the picture reverses almost completely: Native American Y-chromosomes were found in 97 percent of Aymaras and 78 percent of Quechuas, nearly all of it the founding American haplogroup Q. Peru shows the same internal split. A 2001 study of a Quechua speaking Andean community found Native American Y-chromosomes in 48 percent of men, while an urban Mestizo sample of 290 men from the wider Peruvian population, the kind of sample that would ordinarily be expected to look the most European, still came out 56.2 percent haplogroup Q. In Peru's Amazonian populations the figure climbs past 90 percent, among the highest Native Y-chromosome retention documented anywhere in the hemisphere.
Why the Andes were different
The mechanism is demographic, not biological. Where the precolonial population was large, dense and administratively organized, as in the core of the Inca state and the Altiplano around Lake Titicaca, Spanish colonization functioned through extraction: the encomienda and later the mita labor draft governed an existing, numerically overwhelming Indigenous society rather than replacing it with settlers. Where the precolonial population was smaller, more dispersed, or collapsed early and catastrophically under epidemic disease, as across much of the Caribbean, the Colombian interior and the temperate Southern Cone, colonization proceeded instead through settlement, and the demographic balance between the small number of colonizing men and the remaining Indigenous population tipped the paternal line toward Europe within a few generations. Tierra del Fuego, at the very southern tip of Argentina, is the clearest illustration of the settlement pole: a 2022 study of 196 men found 94.4 percent Eurasian Y-chromosome haplogroups and just 5.1 percent Native American ones, a population history of near total replacement rather than admixture.
The mothers stayed Native, almost everywhere
Whatever the Y-chromosome does, mitochondrial DNA tells a far more consistent story across the same countries. In Antioquia the maternal line is about 90 percent Native American even where the paternal line is 94 percent European. In Mexico the equivalent figure is about 89 percent. In Peru, an urban sample spanning Lima and thirty three other cities found 90 percent Native American mtDNA, and the same 2001 Andean Quechua study that found only 48 percent Native paternal lineages found 90.4 percent Native maternal ones, a ninefold difference in admixture rate between the two parental lines within the identical community. Even in the Bolivian Altiplano, where the paternal line barely admixed at all, the maternal line for the specific B2 haplogroup alone already runs at 81 percent in Aymaras and 61 percent in Quechuas, likely an underestimate of total Native maternal ancestry since B2 is only one of the four founding American mtDNA lineages. The mothers of Latin America, from the most heavily admixed mestizo cities to the most isolated Andean communities, are overwhelmingly the same population that was there before 1492.
What haplogroup frequencies cannot say
Three limits, stated before anyone else states them. A Y-chromosome or mtDNA haplogroup is a single unrecombined lineage, one data point out of many thousands of ancestors a person carries; a Bolivian man with a fully Native American Y-chromosome and Native American mtDNA can still carry a substantial share of European ancestry across the rest of his genome, since every other ancestral line is free to have come from anywhere. A study of Bolivian and Totonac populations using genome wide autosomal markers found that individuals carrying entirely precolonial Y-chromosome and mtDNA haplogroups still showed between 5 and 30 percent European autosomal ancestry, and average European admixture across the wider Bolivian sample studied came out around 12 percent even though the country's uniparental markers look far more strongly Native. Second, national forensic samples are not neutral with respect to region: the Bolivian 65 percent European Y-chromosome figure comes from a sample drawn across five departments including the more urban, lowland and historically more settler heavy Santa Cruz, and does not describe the Aymara or Quechua populations specifically, who were sampled separately by a different study. Third, sample sizes for some of the populations compared here are small, in the tens rather than the hundreds of individuals, and single studies of this kind carry real sampling uncertainty that a larger successor study could shift by several percentage points in either direction.
Myth and measurement
| The claim | What the evidence shows |
|---|---|
| Latin America's colonization by Spain and Portugal was a genetically homogeneous process that should show the same paternal versus maternal split everywhere. | The size of the split ranges from near total, 94 percent European Y-chromosome against 1 percent Native in Antioquia, Colombia, to almost none at all, 97 percent Native Y-chromosome in Bolivian Aymara communities. Demographic weight at contact, not distance from Spain, predicts the outcome. |
| Because most of Latin America shows a European dominated Y-chromosome, Peru and Bolivia should look the same. | Peru's own urban Mestizo population, the sample most likely to look European, still carries a majority Native American Y-chromosome, 56.2 percent, and the Andean interior of both countries runs from 48 to 97 percent depending on the specific community sampled. |
| A population with an almost entirely Native American Y-chromosome and mtDNA has an almost entirely Native American genome. | Genome wide autosomal data from Bolivia shows individuals with fully precolonial uniparental markers still carrying 5 to 30 percent European ancestry elsewhere in the genome; haplogroup frequency and autosomal ancestry answer two different questions. |
| The mother's line should show the same country by country variation as the father's line. | Mitochondrial DNA converges on roughly 80 to 90 percent Native American across nearly every population compared here, from heavily admixed Antioquia to the Peruvian Andes, regardless of how far the paternal line has shifted toward Europe. |
References
- PNAS 2006 Bedoya G, Montoya P, Garcia J, Soto I, Bourgeois S, Carvajal L, Labuda D, Alvarez V, Ospina J, Hedrick PW, Ruiz-Linares A. Admixture dynamics in Hispanics: a shift in the nuclear genetic ancestry of a South American population isolate. PNAS 103:7234-7239. https://doi.org/10.1073/pnas.0508716103
- PNAS 2010 Bryc K, Velez C, Karafet T, Moreno-Estrada A, Reynolds A, Auton A, Hammer M, Bustamante CD, Ostrer H. Genome-wide patterns of population structure and admixture among Hispanic/Latino populations. PNAS 107:8954-8961. https://doi.org/10.1073/pnas.0914618107
- Hum Genet 2009 Sandoval K, Buentello-Malo L, Penaloza-Espinosa R, Avelino H, Salas A, Calafell F, Comas D. Linguistic and maternal genetic diversity are not correlated in Native Mexicans. Human Genetics 126:521-531. https://doi.org/10.1007/s00439-009-0693-y
- FSI Genet SS 2019 Villaescusa P, Blazquez P, Martinez-Jarreta B, Jimenez S, Alvarez-Gila O, de Pancorbo MM. The impact of haplogroup R1b-DF27 in Hispanic admixed populations from Latin America. Forensic Science International: Genetics Supplement Series. https://www.sciencedirect.com/science/article/pii/S1875176819302379
- Sci Rep 2017 Sole-Morata N, Garcia-Fernandez C, Urasin V, Bekada A, Zalloua P, Comas D, Calafell F. Analysis of the R1b-DF27 haplogroup shows that a large fraction of Iberian Y-chromosome lineages originated recently in situ. Scientific Reports 7:7341. https://doi.org/10.1038/s41598-017-07710-x
- FSI Genet 2014 Cardenas JM, Heinz T, Pardo-Seco J, Alvarez-Iglesias V, Taboada-Echalar P, Sanchez-Diz P, Carracedo A, Salas A. The multiethnic ancestry of Bolivians as revealed by the analysis of Y-chromosome markers. Forensic Science International: Genetics 14:210-218. https://www.sciencedirect.com/science/article/abs/pii/S1872497314002397
- AJPA 2011 Gaya-Vidal M, Moral P, Saenz-Ruales N, Gerbault P, Tonasso L, Villena M, Vasquez R, Bravi CM, Dugoujon JM. mtDNA and Y-chromosome diversity in Aymaras and Quechuas from Bolivia: different stories and special genetic traits of the Andean Altiplano populations. American Journal of Physical Anthropology 145:215-230. https://doi.org/10.1002/ajpa.21487
- Egypt J Forensic Sci 2023 Analysis of 27 Y-chromosomal STR loci of the Mestizo Peruvian population. Egyptian Journal of Forensic Sciences. https://doi.org/10.1186/s41935-023-00366-x
- 2023 Analysis of 27 STR markers of the chromosome Y in the population of the jungle from Peru. https://www.sciencedirect.com/science/article/abs/pii/S2445424923000146
- Hum Hered 2001 Rodriguez-Delfin LA, Rubin-de-Celis VE, Zago MA. Genetic diversity in an Andean population from Peru and regional migration patterns of Amerindians in South America: data from Y chromosome and mitochondrial DNA. Human Heredity 51:97-106. https://doi.org/10.1159/000022964
- PLOS ONE 2018 Signs of continental ancestry in urban populations of Peru through autosomal STR loci and mitochondrial DNA typing. https://doi.org/10.1371/journal.pone.0200796
- J Hum Genet 2013 Sandoval JR, Salazar-Granara A, Acosta O, Castillo-Herrera W, Fujita R, Pena SD, Santos FR. Tracing the genomic ancestry of Peruvians reveals a major legacy of pre-Columbian ancestors. Journal of Human Genetics. https://www.nature.com/articles/jhg201373
- BMC Genet 2012 Watkins WS, Xing J, Huff C, Witherspoon DJ, Zhang Y, Simms T, Jorde LB. Genetic analysis of ancestry, admixture and selection in Bolivian and Totonac populations of the New World. BMC Genetics 13:39. https://www.ncbi.nlm.nih.gov/pmc/articles/PMC3432609/
- Genes 2022 Tierra Del Fuego: What Is Left from the Precolonial Male Lineages? Genes 13:1712. https://www.mdpi.com/2073-4425/13/10/1712