
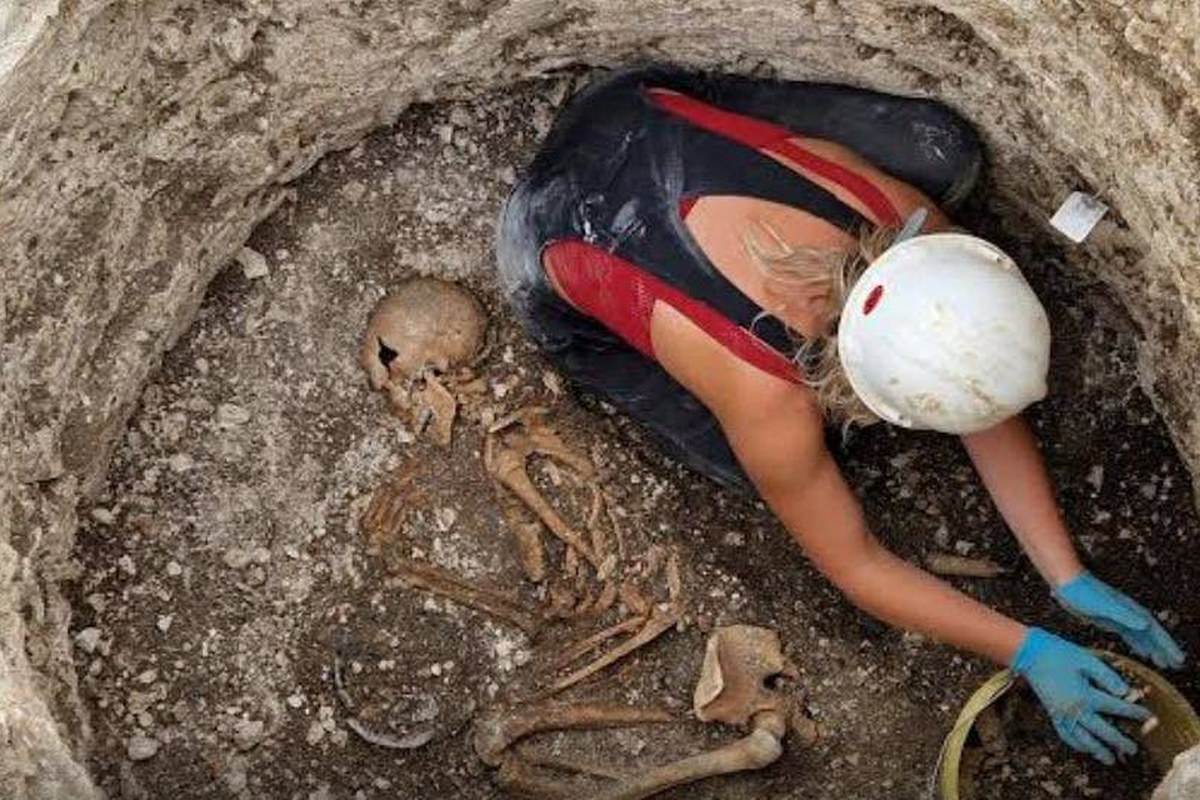
In January 2025 a team led by Lara Cassidy and Daniel Bradley published fifty-seven genomes from Durotrigian cemeteries in Dorset and reported something that had never been documented in European prehistory: a community in which the women stayed and the men arrived. Two thirds of the buried kin group descended from one woman through the female line. The male lineages were a scatter. The finding travelled fast, usually under headlines about two thousand years of patriarchal assumptions being overturned. This article does something narrower and, we hope, more useful. It takes the same burials, puts them through a Global25 calculator, and asks three questions. Where do these people actually sit? Can a coordinate calculator see the Channel crossing the paper describes? And can it see the matrilocality at all? The answers are: closer to a living Englishman than to a Scottish Iron Age burial; partly, and only along one axis; and no, not even slightly, except in one place where it finds two men by accident. A fourth section follows the same route in reverse, to a Late Iron Age port on a Normandy beach where people were working Dorset shale.
A cemetery in Dorset
Iron Age human remains are rare in Britain. Most of the population appears to have been cremated, excarnated, or deposited in rivers and bogs, and the archaeological record of the last five centuries BC is a record of hillforts and rubbish pits rather than of people. Dorset is the exception. The communities the Romans called the Durotriges, occupying the central southern English coast from roughly 100 BC to AD 100, buried their dead in formal cemeteries, flexed on one side in shallow oval graves, often with pots and joints of meat and occasionally with a great deal more.
Since 2009 the Durotriges Project of Bournemouth University has been excavating a settlement complex near Winterborne Kingston, nicknamed Duropolis, which runs from the later Bronze Age through to the post-Roman period. It had already produced an archaeological observation that mattered: the richly furnished graves at these sites tend to be the graves of women. The mirror burial from Langton Herring, published by Miles Russell and colleagues in 2019, is the best known example.
Our earlier article on the Durotriges, the women stayed, the men crossed the sea, took that paper as its subject and set out what it found. This one asks a narrower question: what a coordinate calculator can add to it, and where it goes silent.
The genetic result that followed is worth stating precisely, because the popular versions of it are looser than the paper. Fifty-five individuals were sequenced from Winterborne Kingston, plus one each from Langton Herring and Maiden Newton. Forty reached coverage high enough for imputation and identification of shared segments. Thirty of those forty had at least one relative of roughly the seventh degree or closer, so the site is one large kin group rather than a village burial ground. Of the thirty-four genetically identified kin, twenty-four carry a rare lineage within mitochondrial haplogroup U5b1, previously unseen in ancient sampling and present in modern data at a frequency of about three in a hundred thousand. Four downstream mutations split that lineage into subclades unique to the site, and the authors calculate that at least four hundred and twenty female births to lineage mothers would be needed to generate that much internal variation. This was not a founder effect from last week.
Against that, Y chromosome diversity is high, and runs of homozygosity indicate an outbreeding community rather than an isolated one. Simulations of male and female dispersal fit an outward female migration rate close to zero and a male rate somewhere between 0.15 and 1 per generation. Six individuals, all of them male, have no detectable genetic connection to the kin group at all, and four of the six were buried in normal Durotrigian fashion with local pottery, so they were not outsiders in any social sense. Eight of the ten related individuals who do not carry the dominant maternal lineage are also male.
The pattern is unambiguous and it is a pattern about residence, not about power. Husbands moved to their wives' communities. Whether that made Durotrigian women powerful is an inference, although a well supported one: matrilocality does not require female political authority but is strongly associated with it across the ethnographic record, and it sits oddly well with what Roman writers found remarkable about British women.
How widespread was it?
The part of the paper that got less coverage is the part that generalises. Cassidy and colleagues took 156 archaeological sites spanning the Neolithic to the Iron Age, pruned first-degree relatives, and computed mitochondrial haplotype diversity for each. Six communities came out as extreme outliers, and all six are English Iron Age: Worlebury in Somerset, Bottle Knap in Dorset, Gravelly Guy in Oxfordshire, Trethellan Farm and Tregunnel in Cornwall, and Pocklington in Yorkshire. Eleven of the lowest diversity estimates in the whole survey are British Iron Age populations. Thirteen sites are less diverse than Winterborne Kingston itself: twelve of them are British and the thirteenth is a La Tene cemetery in Hungary.
At Pocklington, the second largest British cemetery in the dataset, twenty-eight of thirty-three individuals belong to one of three dominant maternal haplogroups, again split into subclades by private mutations. Y chromosome diversity at these sites shows no corresponding reduction, and shows no correlation at all with how closely related the buried population is.
The cross-site evidence is the clincher. Thirty pairs of relatives were found between different sites, most of them between two and forty kilometres apart, and not one of those pairs shares a mitochondrial haplotype. Within sites, by contrast, just over half of related pairs share their mtDNA. Dibbles Farm and Worlebury Hillfort, both on the Bristol Channel coast, share eight relative pairs and are each dominated by a different matriline. People were moving between communities in numbers, and the people moving were not carrying mitochondria with them.
Data and method
Everything below uses Global25 scaled coordinates, with population averages merged from Davidski's published files and the Moriopoulos 2026 collection. Ancestry proportions come from non-negative least squares with a sum-to-one constraint imposed by appending a heavily weighted row of ones, with the resulting weights normalised. Distances are scaled Euclidean distances multiplied by one thousand, the convention used throughout this site.
The pooled Durotrigian target is built from individual genomes rather than from a published group average, because the individuals are where the interesting structure is. Fifty-two Durotrigian-context genomes are available in the dated ancient sample file. Applying the fifteen per cent coverage threshold used elsewhere in this series, and keeping only the Middle Iron Age, Late Iron Age and Roman-period burials that fall inside the site's Durotrigian phase, gives forty-three individuals dated between about 286 BC and AD 183. Four sub-Roman burials of the early fifth century are kept separate and reported at the end. The pooled average sits 6.6 units from the twenty-six-individual Durotrigian average published in the Moriopoulos collection, which is the ordinary difference between two overlapping samples of the same cemetery.
One panel does the work in every decomposition below, so that rows are directly comparable: the Yamnaya of Samara, the Anatolian Neolithic of Barcin, and the western hunter-gatherer genome from Loschbour. Its condition number is 2.44 and its three pole separations are 338, 410 and 494 units, all far above the hundred-unit threshold below which we treat two-source separation as unreliable on this site. This is the identical panel used in our article on the Corded Ware, so the rows here can be read directly against the rows there.
That choice is not a matter of taste. It is the only well conditioned panel available for this question, and the section below on the panel that does not work explains at some length why every more interesting alternative fails.
Where the Durotriges sit
The simplest measurement sets up everything else.
Every population within reach of the pooled Durotrigian average, ranked by Global25 distance. A living Englishman sits closer than an Iron Age Gaul, and both sit closer than an Iron Age Scot.
Three things on that chart.
The first is at the top. The pooled Middle Iron Age population of England sits 8.6 units from these forty-three people, the Arras culture burials of East Yorkshire 10.4, the pooled Late Iron Age 11.4. Then, at 12.0 units, comes a sample of forty-four living Englishmen. A cemetery in Dorset used before, during and just after the Roman conquest sits closer to the modern English average than the Hallstatt population of northern France does, and closer than the Welsh, the Cornish or the Scots. Two thousand years, the Roman occupation, the Anglo-Saxon settlement, the Danelaw, the Normans, the whole of English history, and the population has moved twelve units.
The second is the geography of the ancient rows. The Hallstatt burials of Hauts-de-France sit 14.0 units away and the La Tene burials of the same region 14.2. The Iron Age of Scotland sits at 25.9 and 27.1. A Dorset community is roughly twice as close to Iron Age Picardy as it is to Iron Age Scotland. That is the Channel, measured. Cassidy and colleagues found the same thing from shared haplotype segments, where several of their IBD clusters straddle the water and none of the peripheral British clusters do.
The third is what happens going backwards in time in the same landscape. The Late Bronze Age of England sits 17.8 units away, the Middle Bronze Age 25.0, the Bell Beaker population of England 42.3, and the Early Bronze Age average 53.3. The Durotriges are further from the Beaker people who occupied southern Britain fifteen hundred years earlier than they are from a living Dutchman. Something happened in between, and the rest of this article is about how much of it a calculator can pin down.
One scale note before anything is built on a gap of twelve units. Of the forty-three Durotrigian individuals, the median distance to their own pooled mean is 24.5 units. Of thirty-two individually genotyped modern Englishmen, the median distance to their own mean is 22.5. The internal scatter of one Iron Age kin group in one Dorset field is the same as the internal scatter of a modern national sample, and it is twice the entire gap between that kin group and the modern English average. These are not two populations. They are two samples of one continuous thing at different points on its history.
The deep decomposition
Breaking the same populations into ancient components gives the shape of each gene pool.
The same three-source panel applied to the Durotriges, to their Bronze Age predecessors, to their Iron Age neighbours on both sides of the Channel, and to the modern populations of the islands.
The Durotriges come out at 45.6 per cent steppe, 40.2 per cent Anatolian Neolithic farmer and 14.2 per cent western hunter-gatherer, with a fit of 37.9 units.
That middle figure deserves attention, because it was arrived at independently. Cassidy and colleagues quantified Early European Farmer ancestry in British Iron Age genomes using qpAdm on pseudo-haploid genotypes with Mesolithic, Yamnaya and Early Neolithic sources, which is a considerably more powerful instrument than a coordinate calculator, and reported 39.7 per cent for the Early Iron Age rising to 41.8 per cent for the Late Iron Age. A three-source non-negative least squares fit on Global25 coordinates returns 40.2 for the Durotrigian sample. This is the third time in this series that a Global25 model has landed close enough to a much better method to be worth pointing at, and as before the agreement is on the proportion, not on the second decimal place.
The figure is also robust to the panel. Swapping the farmer pole from Barcin to the Anatolian Neolithic of Mentese moves it to 39.7. Swapping the steppe pole from Samara to the Yamnaya of Kalmykia moves it to 39.6.
Read the whole column and it is a single axis, and the axis is geographic.
Farmer weight under the identical panel, from the Beaker period to the present. The Iron Age spread is geographic, not chronological.
The Bell Beaker population of England sits at 28.4 per cent farmer ancestry and the Early Bronze Age at 26.3. By the Middle Bronze Age it is 33.4, by the Late Bronze Age 35.7. Then the Iron Age fans out by region rather than by date. The Iron Age of Scotland sits at 32.9 and 33.8, barely above the Middle Bronze Age level of the island as a whole. The Arras culture of East Yorkshire sits at 37.7. The Durotriges sit at 40.2. And the Iron Age of northern France sits at 40.5 and 42.2, which is to say inside the Dorset range rather than outside it.
That is the paper's central demographic claim reproduced from a different direction. Continuity with the British Early Bronze Age is strongest at the periphery, estimated at 92 per cent in Scotland and 88 per cent in northern England by the published haplotype analysis, and weakest along the southern coast, where the Hampshire estimate falls to 60 per cent. On this chart the peripheral populations sit at one end and the Channel coast sits at the other, next to Gaul.
One row deserves a separate sentence because it is the reason so many readers find the modern figures confusing. The Anglian burials of Scorton, dated to around AD 400, come out at 32.7 per cent farmer ancestry, which is lower than any Iron Age English population on the chart and close to the Iron Age of Scotland. The incoming Anglo-Saxon populations were not more Neolithic than the Britons they settled among; they were less so. Anyone using this axis as a proxy for continental ancestry in general, rather than for southern continental ancestry specifically, will get the Anglo-Saxon period exactly backwards.
The panel that does not work
Which brings us to the question this article cannot answer, and to the reason why.
The obvious thing to try is a proximal model. Take the British Bell Beaker population as the insular baseline, offer the model a second source from across the Channel, and read off how much of the Durotrigian gene pool arrived by boat. The published estimate is that roughly 73 to 75 per cent of English and Welsh Iron Age ancestry comes from the British Early Bronze Age, dropping to about 60 per cent in Hampshire. A calculator ought to be able to say something about that.
It cannot, and the way it fails is instructive enough to be worth a chart.
Seven candidate second sources added to a British Bell Beaker baseline. Each supplies almost exactly the farmer increment the target requires, whatever else it is.
Modelling the Durotriges as British Bell Beaker plus one extra source gives a baseline fit of 42.3 units with the Beaker source alone. Adding the Hallstatt population of Burgundy improves that to 11.5 units, an improvement of 72.9 per cent, with the Burgundian source taking 53.6 per cent of the weight. Adding the Hallstatt population of Hauts-de-France improves it to 11.7 units, an improvement of 72.5 per cent, with the source taking 84.1 per cent of the weight. Adding the Globular Amphora farmers of Neolithic Poland, a population separated from the Durotriges by two thousand years and a thousand kilometres, improves it to 12.1 units and 71.4 per cent, taking 23.6 per cent weight. Adding the Anatolian Neolithic village of Barcin, a population that has nothing whatever to do with Iron Age Britain, improves it by 53.4 per cent.
Now look at what those weights are doing. Multiply each source's weight by the amount of farmer ancestry it carries in excess of the Beaker baseline and the products are 11.94, 11.64, 11.18, 11.38, 11.07, 10.15 and 8.48 percentage points. The target needs 11.83. Every candidate is delivering the same number. A source with half again the farmer ancestry gets half the weight; a source with four times as much gets a quarter. The model is not choosing between Gaul and Poland and Anatolia. It is solving a single scalar equation, and any population anywhere on the farmer axis will satisfy it.
The pole separations say why. The British Bell Beaker average sits 43 units from the La Tene population of Hauts-de-France and 48 from the Hallstatt population of the same region. Our working threshold for trusting a two-source split is a hundred units. At forty, the two sources are for practical purposes the same point, and the fitted weights are the ratio of two small numbers each of which is mostly noise, which is why they run to 84 and 93 per cent, figures that would make the Durotriges nine tenths Gaulish and that nobody believes.
This is the collinearity trap our article on the Quebecois documented at length, in an unusually clean form. The honest statement is that Global25 can measure how much farmer ancestry a British Iron Age population carries, and can measure it well. It cannot say which continental population supplied it, because on the only axis it can see, all the candidates look alike. The published haplotype analysis can do that, because shared segment lengths carry information about time and source that a twenty-five dimensional summary of allele frequencies has thrown away.
The two men who married in
Group averages hide people. This is the section where they stop hiding them, and it is the one place in this article where the calculator finds something the paper reports from a completely different kind of evidence.
Forty-three Durotrigian individuals under the identical model. Dots are offset vertically only to stop them overlapping.
Under the identical three-source panel, the forty-three Durotrigian individuals have a mean farmer ancestry of 40.2 per cent with a standard deviation of 2.8, running from 34.7 to 49.6. That distribution is tight. There is no second cluster, no bimodality and no trend across the two and a half centuries the cemetery was in use: regressing farmer ancestry on date gives a correlation of 0.23 with a p-value of 0.14, and splitting the sample at 50 BC gives means of 40.0 and 40.3 with no significant difference at all. Whatever movement was happening across the Channel during the Durotrigian period, this cemetery did not record it as a shift in its own average.
What it did record is at the right-hand end. The highest value in the entire distribution, 49.6 per cent, belongs to WBK02, a man dated to around 109 BC and sitting 3.3 standard deviations above his community's mean. Every one of the twelve populations nearest to him in the whole reference set is continental: the La Tene population of Burgundy at 21.9 units, the Bell Beaker of Provence at 22.2, the Hallstatt of Burgundy at 22.8, a Late Iron Age group from Hassleben in Germany at 23.4, the Hallstatt of Grand Est, the Magdalenenberg burials, the La Tene of Bohemia. Not one British population appears in his top twelve. He sits 37.2 units from the mean of the community he was buried in.
Cassidy and colleagues identified WBK02 independently, from principal components and haplotype copying, as an outlier whose ancestry derives mainly from continental Europe, and inferred that he was one of two non-lineage men who married women of the matriline.
The third highest value on the chart, 44.4 per cent, belongs to WBK195, dated to the same century. And WBK02 and WBK195 are, in the paper's reconstructed pedigree of the whole cemetery, the only pair related through the male line beyond the first degree. In a community of forty-three burials organised entirely around descent from one woman, there is exactly one father-line link, and the two men it connects are the two most continental individuals in the graveyard.
Drawing two individuals at random from the forty-three and getting a mean farmer ancestry at least as high as their 47.0 per cent happens 0.22 per cent of the time. That is a real result and it does not depend on any of the modelling above, only on a rank order.
What it means is a matter of interpretation, and the paper is careful about it in a way worth copying. A matrilocal community absorbs men. Most of those men come from a few kilometres away and are genetically indistinguishable from the women they marry, which is precisely why the cemetery's autosomal distribution is so tight. Occasionally one comes from much further, and when he does, his sons carry his Y chromosome and half his ancestry into a system that is not organised to record either. The single patrilineal thread the pedigree preserves is the thread that came from overseas. Hengistbury Head, the major cross-Channel port of the Late Iron Age, was in Durotrigian territory.
The traffic the other way
Everything so far has treated the Channel as something people crossed northwards. It was not. Twelve kilometres west of Cherbourg, on the exposed foreshore of the Hague peninsula in the Manche, lies a site that has been eroding into the sea since it was found in 1868 and that faces Dorset directly across the water.
Urville-Nacqueville was recognised as a La Tene settlement by Georges Rouxel, who worked the beach between 1904 and 1922 and concluded that the maker of bracelets he kept finding there had not lived in an isolated hut but in an agglomeration on a trade route. Anthony Lefort and Cyril Marcigny published a reassessment of the whole dossier in 2009 which is the reason this section exists, and their reading is that it was a port.
The archaeology is unusually specific about which port it was trading with. The site's defining find is a shale bracelet workshop: eighty-six pieces survive in the Museum E. Liais at Cherbourg and twenty more at the Musee de l'Homme, most of them roughouts abandoned partway through manufacture. Where the raw material came from was argued over for a century, because as one nineteenth-century observer established by burning a sample, no stone in the Cotentin has those properties. In the 1990s Pierre-Roland Giot connected the Armorican shale industry to the Kimmeridge beds of Dorset, and a palynological analysis of one Nacqueville fragment by James Riding attributed it to Kimmeridge with certainty. People on that beach were working Dorset stone.
They were also, in at least one case, cooking in a Dorset pot. Among the ceramics is a group of vessels with countersunk handles, a form found on both sides of the water; petrographic analysis of one of the Nacqueville handles by Lisa Brown of Oxford Archaeology concluded that the fabric was exogenous and typical of Durotrigian production in what is now Dorset. Alongside that sit black cordoned wares of the type that first established the Armorica to Hengistbury Head link, Dressel 1A wine amphorae from Italy, two gold globule a la croix staters, and a corroded iron blade with no cutting edge and no central rib which Lefort reads as a fragment of a sword-shaped currency bar, an object type concentrated in Dorset and southern England.
And the buildings are round. Six circular structures have been identified on the foreshore, a house form that is standard across Iron Age Britain and distinctly uncommon on the continent. Lefort and Marcigny take it as evidence of British cultural presence rather than merely British goods. Cassidy and colleagues add that the later cemetery excavated at the site contains flexed inhumations in shallow oval graves, which is the Durotrigian rite.
Three genomes from that site are in the Global25 release, all dated to around 100 BC.
Three Late Iron Age genomes from the Cotentin foreshore, pooled, against every population within reach. The bottom of the chart carries the signal; the top is a tie.
The pooled average of those three sits 21.8 units from the English Early Iron Age, 22.2 from the pooled Middle to Late Iron Age, 22.6 from the Middle Iron Age, 23.2 from the La Tene population of Grand Est and 23.3 from that of Hauts-de-France. It sits 25.9 from the Durotriges themselves, 30.8 from the modern inhabitants of its own department, 33.9 from the Bretons and 48.0 from the Hallstatt population of Burgundy.
The caveats have to come before the interpretation, and they are heavy. Three genomes at fourteen, seventeen and twenty-four per cent coverage are noisy in a way that group averages usually hide, and here it is visible: the three individuals sit 49, 52 and 54 units from each other, which is further than the entire vertical span of that chart. Their individual fits under the deep panel run from 51 to 53 units against 38 for the Durotrigian average. The top eight rows are a tie and nothing whatever should be read into the ordering inside them.
What the chart does support is the two ends. The Cotentin group falls inside the cross-Channel cluster of Iron Age Britain and northern Gaul, and it falls well outside interior Gaul: the gap to Burgundy, at 48.0, is twice the gap to anything at the top. It also sits further from its own modern successors in the Manche, and much further from the Bretons, than from any Iron Age British population measured. And the reference figure the whole exercise is chasing, the published estimate that the Urville-Nacqueville outlier draws about 72 per cent of its ancestry from the British Bronze Age, cannot be reproduced here at all, for exactly the reason set out three sections ago: Dorset and Gaul sit 20 units apart in this coordinate space, and no two-source model survives a pole separation of twenty.
So the honest summary is that the geometry is consistent with the haplotype result and cannot confirm it. What confirms it is a beach full of Kimmeridge shale, a Durotrigian cooking pot, six round houses and a Dorset currency bar. The genetics of this site were legible to an archaeologist a century before anyone sequenced anything, and the calculator arrives late and out of breath with a result that says, roughly, yes.
One more thing follows from it that matters for the article's main subject. If men were the mobile sex in Iron Age Britain, and if the Channel was a two-way route rather than a one-way one, then the man from Nacqueville who ends up buried in a Dorset cemetery and the man from Dorset who ends up on a Cotentin beach are the same phenomenon operating at longer range than usual. WBK02 is the visible tail of a distribution whose bulk moved twenty kilometres and left no trace a calculator can find.
How much would have been visible?
A null result is worth nothing unless the method could have produced a positive one, so the detection floor was measured rather than assumed.
Recovery of a known continental contribution injected into an insular Iron Age baseline, measured on the farmer axis.
Taking the Iron Age of Scotland as an insular baseline and mixing in known quantities of the Hallstatt population of Hauts-de-France, then pushing the synthetic result back through the identical panel, gives the recovery curve above. One per cent injected moves farmer ancestry by 0.09 points. Five per cent moves it by 0.47. Ten per cent moves it by 0.93. Thirty per cent moves it by 2.80.
Set that against the noise. The standard error of a mean over forty-three individuals is 0.43 points. So a group average of this size can detect a continental contribution of roughly ten per cent at one standard error and twenty per cent at two, and cannot detect five per cent at all. For a single genome the standard deviation is 2.8 points, which means an individual needs something on the order of thirty per cent continental ancestry before he begins to stand out and sixty per cent before he stands out unambiguously. WBK02, at 9.4 points above the mean, is off that scale entirely, which is the honest reason he is visible and the twenty-nine other unrelated or in-marrying individuals in the cemetery are not.
This is also the honest answer to why our within-cemetery time trend is flat while the published qpAdm analysis finds a significant Early to Late Iron Age rise from 39.7 to 41.8 per cent. A rise of 2.1 points across the whole channel core region, pooling many sites and many centuries, is at the edge of what forty-three genomes from one Dorset field could resolve, and the paper's own signal is a regional one assembled from several cemeteries rather than a trend inside any single one. Our flat line is not a contradiction of their result. It is a smaller instrument failing to see a real thing.
What the autosomes cannot see
Here the article has to stop and be honest about its instrument, because everything above is silent on the finding that made the paper famous.
Autosomes are inherited from both parents in equal measure and they carry no label saying which side they came from. A Global25 coordinate is an autosomal summary. It can tell you that a Durotrigian individual is 45.6 per cent steppe and 40.2 per cent farmer. It cannot tell you whether that person's grandmother was born in the same valley and their grandfather forty kilometres away, and no amount of source selection will make it tell you. Matrilocality is a statement about where people lived after marriage. It is legible in mitochondrial haplotype diversity, in Y chromosome diversity, in the sex ratio of unrelated burials and in the shape of a pedigree, and it is invisible in the twenty-five numbers this article has been manipulating.
Readers of our article on the Corded Ware will recognise the situation from the other side. There, the Y chromosomes of central Europe were replaced almost completely across a few centuries while the mitochondria stayed substantially local, and four women buried at Vlineves and Stadice with Corded Ware rites carried none of the ancestry that defined the culture. The autosomal data could show that those four women were farmers, because they were a different population. It could not show that they were women, or that they had married in rather than been captured or fostered; that came from the sex determinations and the pedigree. In Dorset the same limitation bites harder, because the men marrying into the Durotrigian matrilines were, with two exceptions, not a different population at all. They were the boy from the next valley. An autosomal calculator has nothing to say about him, and the entire social system this article is nominally about consists of him.
It is worth stating the size of the gap plainly. The paper's simulations put outward female migration at close to zero and male migration at between 0.15 and 1 per generation. A community exchanging up to one man per generation with its neighbours for two hundred and fifty years would, on the numbers in the previous section, produce no detectable movement in its Global25 average whatsoever, because the men are drawn from a pool that differs from the receiving community by a few units at most. The social structure and the genetic signal live on completely different scales. That is not a failure of the method so much as a demonstration that residence rules and ancestry proportions are answers to different questions, and that a calculator answers only one of them.
After the legions
Four burials at Winterborne Kingston date to the early fifth century AD, three of them at usable coverage, and they are worth a paragraph because of what they are not.
Pooled, they sit 26.8 units from the Durotrigian mean and return 47.3 per cent steppe, 39.3 per cent farmer and 13.4 per cent hunter-gatherer, which is the Durotrigian profile to within the noise of three individuals. Their distances to the Durotrigian average, individually, are 36.2, 31.2 and 33.8 units, all inside the ordinary scatter of the cemetery itself. The Anglian burials of Scorton sit 30.7 units from the Durotrigian mean and carry seven points less farmer ancestry, so a Germanic contribution of any size would push these three the other way along the axis. It does not. Three genomes cannot establish an absence, and this is emphatically not a statement about the Anglo-Saxon settlement of England, which happened later and mostly elsewhere. But at this particular site, at the moment the Roman administration ended, the people in the ground were still the people who had been in the ground for five hundred years.
What the calculator is for
Three findings, in descending order of confidence.
The Durotriges of Dorset carry 40.2 per cent Early European Farmer ancestry, which reproduces the published qpAdm figure for the Late Iron Age Channel coast, and they sit at the continental end of a British gradient that runs from 26 per cent in the Early Bronze Age through 33 per cent in Iron Age Scotland to 42 per cent in Iron Age Picardy. The gradient is geographic before it is chronological. That is solid.
The one man in that cemetery whom the published pedigree marks as the source of its only father-line thread is also the most continental individual in it by a wide margin, and his patrilineal relative is the third most continental. Two independent kinds of evidence, one from shared segments and one from allele frequencies, point at the same two burials. That is a genuine convergence and the permutation test puts it at better than one in four hundred.
The Cotentin port of Urville-Nacqueville, whose people were carving Kimmeridge shale from Dorset and eating out of a Durotrigian pot, sits inside the cross-Channel cluster and a long way outside interior Gaul. The proportion cannot be recovered from these coordinates and the archaeology says it better anyway. That is a direction, not a number.
And the thing the whole story is about, the residence rule that made a Dorset cemetery into the burial ground of one woman's descendants for four hundred years, does not appear anywhere in these numbers and could not have. The mitochondria said it. The Y chromosomes corroborated it. The autosomes, which are ninety-eight per cent of the genome and the only part a Global25 calculator can see, had nothing to contribute. It is a useful reminder of what these coordinates are: a very good instrument for measuring where a population came from, and no instrument at all for measuring how it lived.
Coordinates
The two pooled averages built for this article, in Global25 scaled format, for anyone who wants to reproduce or contest the numbers above.
Durotriges_Dorset_MIA_LIA_Roman:AVG_n43,0.129097,0.137238,0.059524,0.044657,0.041210,0.015955,0.001918,0.004540,0.008566,0.009519,-0.005548,0.007465,-0.015602,-0.015743,0.018045,0.009460,-0.002638,0.001028,0.000766,0.004685,0.006506,0.001970,-0.001869,0.006582,0.000287
Durotriges_Dorset_SubRoman:AVG_n3,0.127482,0.133711,0.056945,0.045651,0.044111,0.019429,-0.001410,0.007615,0.009340,0.004981,-0.002923,0.009342,-0.018632,-0.012019,0.021399,-0.005790,-0.019297,0.002998,0.006913,0.000917,0.003536,0.000824,-0.001232,0.005422,-0.002914
References
- Cassidy, L. M., Russell, M., Smith, M., Delbarre, G., Cheetham, P., Manley, H., Mattiangeli, V., Breslin, E. M., Jackson, I., McCann, M., Little, H., O'Connor, C. G., Heaslip, B., Lawson, D., Endicott, P. and Bradley, D. G. Continental influx and pervasive matrilocality in Iron Age Britain. Nature 637, 1136 to 1142 (2025).
- Patterson, N. et al. Large-scale migration into Britain during the Middle to Late Bronze Age. Nature 601, 588 to 594 (2022).
- Gnecchi-Ruscone, G. A. Women were at the centre of social networks in Iron Age Britain. Nature news and views (2025).
- Russell, M., Smith, M., Cheetham, P., Evans, D. and Manley, H. The girl with the chariot medallion: a well-furnished, Late Iron Age Durotrigian burial from Langton Herring, Dorset. Archaeological Journal 176, 196 to 230 (2019).
- Gretzinger, J. et al. Evidence for dynastic succession among early Celtic elites in Central Europe. Nature Human Behaviour (2024).
- Fischer, C.-E. et al. Origin and mobility of Iron Age Gaulish groups in present-day France revealed through archaeogenomics. iScience 25, 104094 (2022).
- Oota, H., Settheetham-Ishida, W., Tiwawech, D., Ishida, T. and Stoneking, M. Human mtDNA and Y-chromosome variation is correlated with matrilocal versus patrilocal residence. Nature Genetics 29, 20 to 21 (2001).
- Lefort, A. and Marcigny, C., with Baron, A., Binet, C., Brown, L., Cunliffe, B., Ghesquiere, E., Paysan, E., Ralston, I., Wirth, S. and Yvon, J.-M. La probable agglomeration portuaire du second age du Fer d'Urville-Nacqueville. Un etat de la documentation. Bulletin de l'AMARAI 22, 39 to 81 (2009).
- Lefort, A., Meniel, P., Blondel, F. and Rottier, S. Artisanat, commerce et necropole. Un port de La Tene D1 a Urville-Nacqueville. In Les Gaulois au fil de l'eau, Actes du XXXVII colloque de l'AFEAF, Montpellier 2013, Presses Universitaires de Franche-Comte, 481 to 514 (2015).
- Cunliffe, B. Hengistbury Head, Dorset, Vol. 1: The prehistoric and roman settlement, 3500 BC to AD 500. Oxford University Committee for Archaeology, monograph 13 (1987).
- Cunliffe, B. and de Jersey, P. Armorica and Britain: cross-channel relationships in the late first millennium BC. Oxford University Committee for Archaeology, monograph 45 (1997).
- Global25 coordinates by Davidski, Eurogenes Blog. Population averages from the Moriopoulos 2026 collection. NNLS modelling performed independently; the Vahaduo tool implements the same approach.