
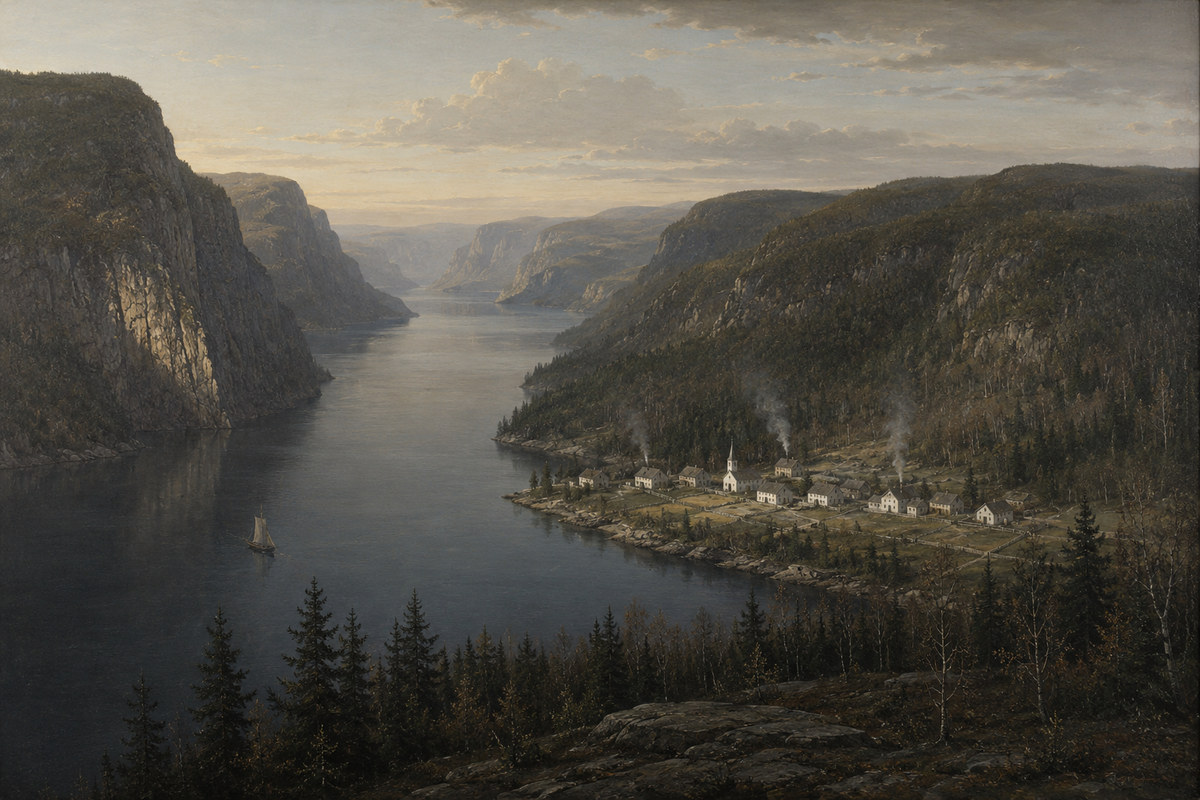
Saguenay-Lac-Saint-Jean is probably the most intensively studied founder population on earth. One person in five carries a pathogenic variant for at least one of four severe recessive diseases. The province runs a free carrier screening programme for the region because five mutations are enough to catch almost every carrier. And yet, if you drop a Quebecois into a Global25 calculator, nothing unusual happens at all: the coordinates come back looking like a slightly averaged Frenchman. This article measures both facts at once, and explains why they are not in conflict.
Three bottlenecks in a row
The demographic history of the population is unusually well documented, because the Catholic parishes of the Saint Lawrence valley kept registers from 1621 and almost none of them have been lost. The BALSAC database at the Universite du Quebec a Chicoutimi and the Registre de la population du Quebec ancien in Montreal together reconstruct something close to the complete pedigree of a nation.
What that pedigree records is three nested founder effects, one inside the next.
The first is the French regime. Between the founding of Quebec City in 1608 and the British conquest in 1760, something on the order of ten thousand immigrants settled permanently in the Saint Lawrence valley, out of a much larger number who crossed and went home again. They came overwhelmingly from the northwest and centre-west of France: Normandy, Ile-de-France, Aunis and Saintonge around La Rochelle, Poitou, Perche, Brittany, Anjou and Maine. Genealogical reconstruction attributes roughly 87 per cent of the present-day gene pool to those French founders, and finds that 98 per cent of randomly chosen pairs of modern Quebecers share at least one common ancestor somewhere in the record.
The second is Charlevoix. From the end of the seventeenth century, families from Quebec City and the Cote-de-Beaupre moved down the north shore into the steep country around Baie-Saint-Paul and La Malbaie. Roughly six hundred individuals settled there between 1675 and 1840. Six hundred. That is the entire genetic input to a region that would later export its population northward.
The third is the Saguenay itself. The valley was closed to settlement by a fur trade monopoly until 1838, which is why the colonisation of Saguenay-Lac-Saint-Jean happened three centuries after Quebec City rather than alongside it. Between 1838 and 1911 nearly thirty thousand people moved in, and about seventy per cent of them came from Charlevoix. The rest arrived later, from other parts of the valley.
There is a fourth ingredient which is not a bottleneck at all but which matters more than any of them. In 2011 Claudia Moreau and colleagues analysed the genealogy of more than a million individuals covering the Quebec expansion between 1686 and 1960 and showed that most people living in Saguenay-Lac-Saint-Jean today descend from ancestors who were living on or near the moving edge of settlement rather than in the settled core. Women on that edge had roughly twenty per cent higher effective fertility than women behind it, and, crucially, fertility was heritable on the front and not in the core. Land was available at the front; competition for it was not. The result is that a small number of families on the wave front contributed disproportionately to everything that came after, and any rare variant that happened to be carried by one of them surfed to a frequency it had no business reaching. A later reanalysis put the effective severity of the whole process at that of a founding population of about three hundred and fifty people, roughly twenty-four times smaller than the actual number of immigrants.
One myth is worth killing here because it comes up in every conversation about the Saguenay. The high frequency of recessive disease in the region is not caused by consanguineous marriage. Marriages between close relatives were no more common in Saguenay-Lac-Saint-Jean than elsewhere in Quebec, and by some measures less common. What matters is not who married their cousin, but how few people the whole population descends from.
What the clinic already knows
The consequences are on the record in a way that is rare in population genetics, because they are measured in patients rather than in models.
Four autosomal recessive diseases are frequent enough in Saguenay-Lac-Saint-Jean, Charlevoix and Haute-Cote-Nord that the Quebec health ministry offers free carrier screening to anyone with a grandparent born in those regions. Autosomal recessive spastic ataxia of Charlevoix-Saguenay occurs in about one birth in 1,932, with one inhabitant in 22 a carrier. Agenesis of the corpus callosum with peripheral neuropathy, known as Andermann syndrome, occurs in about one birth in 2,117, carrier rate one in 23. Leigh syndrome of the French-Canadian type, a cytochrome oxidase deficiency, occurs in about one birth in 2,000 against roughly one in 40,000 worldwide, carrier rate one in 23. Hereditary tyrosinemia type I occurs in about one birth in 1,846 against roughly one in 120,000 worldwide, carrier rate one in 20. Taken together, about one in five inhabitants of the region carries at least one of these alleles.
The list does not stop there. Cystic fibrosis reached one birth in 902 in the region between 1975 and 1988. Mucolipidosis type II runs at one in 6,184, the highest frequency documented anywhere. Vitamin D dependent rickets type I runs at one in 2,916. Zellweger syndrome, cystinosis and Naxos disease all have identified local founder mutations. Lipoprotein lipase deficiency, which affects one or two people per million worldwide, is roughly two hundred times more common here. Myotonic dystrophy type 1 reaches 158 cases per 100,000, the highest prevalence recorded in the world, against a global range of about 2 to 14 per 100,000.
The screening programme itself is the neatest demonstration of what a founder effect is. Testing five mutations detects between 97 and 100 per cent of carriers for the four target diseases, depending on which one. In a population without a founder effect, five mutations would catch a small fraction of carriers, because the same disease would be caused by dozens of different variants in dozens of different families. Here it is almost always the same variant, inherited from the same person.
Data and method
Everything below uses Global25 scaled coordinates, with population averages merged from Davidski's published files and the Moriopoulos 2026 collection. Ancestry proportions come from non-negative least squares with a sum-to-one constraint imposed by appending a heavily weighted row of ones, with the resulting weights normalised. Distances are scaled Euclidean distances multiplied by one thousand, the convention used throughout this site.
The sample situation has to be stated plainly, because it is worse here than in most of our articles and it turns out to be part of the subject matter. Two Quebecois averages are available. The Moriopoulos collection without simulated individuals contains a Quebecois average built from three people. The collection with simulated individuals contains one built from 157. The two averages sit 22 units apart, which is a large gap by the standards of everything measured below. All headline figures in this article use the 157-individual average, and the three-person value is reported alongside wherever it matters. The Acadian and Cajun averages come from the same larger collection for the same reason.
That 22-unit gap is not a scandal, and working out why is the first useful measurement in the article. Within a European regional population, the typical individual sits about 25 units from the population mean: 26.0 for the Nord sample, 24.5 for Brittany, 26.4 for Alsace, 28.1 for the Irish. Drawing three people at random from a population and averaging them therefore misses the true mean by about 14 units on median, and by 17 or more one time in ten. Two independent three-person and 157-person averages of the same population should differ by roughly that amount. They differ by 22. Nothing needs explaining.
Two reference panels do the work. The distal panel is Anatolian Neolithic, western hunter-gatherer from Loschbour, Yamnaya steppe, Iranian Neolithic and a Northeast Asian pole, with a condition number of 3.88 and a minimum pole separation of 281 units. The proximal panel is built from present-day French regional averages, and its condition number is 145.5 with pole separations running from 7.6 to 35 units. Those two numbers are the whole reason the two panels behave so differently, as the section on the collinearity trap shows.
Where the Quebecois sit
The simplest measurement produces a result that is worth two separate paragraphs of interpretation.
Every population within reach of the Quebecois, ranked by Global25 distance. The four nearest are the other French colonial populations of North America; the fifth is Anjou.
The five nearest populations on earth to the Quebecois average are the other French colonial populations of North America. Louisiana Cajuns and Creoles sit at 3 units, Acadians of the Maritimes at 3, Acadians of New Brunswick at 6, Acadians of Nova Scotia at 9, Cajuns of Louisiana at 10. Only after all of them does anything in France appear: Anjou and Maine at 12.5, the HGDP French average at 13.3, Nord and Picardy at 14.0.
That ordering is the founder effect showing itself, and it is the only place in this article where it does so cleanly. The Acadians separated from the Saint Lawrence valley population in the first half of the seventeenth century and were deported in 1755; the Cajuns are Acadians who ended up in Louisiana after the deportation; the three groups have been demographically separate for two hundred and fifty to four hundred years and are today separated by three thousand kilometres. They are nonetheless closer to each other than any of them is to any population in France. A single colonial French gene pool was drawn from northwestern France in the seventeenth century, and it has stayed recognisably itself.
The control rows show this is not simply what North American consumer kits look like. Anglo-Newfoundlanders, sampled 407 strong from an island that is itself a textbook founder population, sit at 30 units. Irish-Newfoundlanders sit at 41, alongside the Irish of Ireland at 41.
The second interpretation is more sobering, and it concerns the French rows. The genealogical record says the founders came from Normandy, Aunis, Ile-de-France, Poitou and Perche. On this chart Normandy sits at 20.5 units and Brittany at 24.5, both further away than Haute-Garonne in the Occitan south at 15.3, a region that contributed essentially nobody. Paris sits at 15.9, behind Nord and Picardy at 14.0. If you tried to reconstruct the origin of the Quebecois from these distances alone you would get the answer wrong.
There are three reasons and all of them are ordinary. Present-day regional samples in France are not the seventeenth-century populations of those regions; four centuries of internal migration, and in the north two world wars, have moved people around. The sample sizes are small, five for Anjou and Maine, ten for the Poitou-Aunis pool, eleven for Paris. And Perche, the small province between Normandy, Maine and Ile-de-France which supplied a disproportionate share of the earliest families and which is repeatedly invoked in the medical literature as the likely source of the Charlevoix-Saguenay ataxia mutation, is essentially unrepresented in Global25. There is one individual from Orne in the whole dataset.
The collinearity trap
The obvious next step is to model the Quebecois as a mixture of French regional sources and read off which region contributed most. This produces a number, and the number is worthless. It is worth showing exactly how worthless, because this is the single most common way that Global25 hobbyist modelling generates confident nonsense about French Canadians.
Offer the model five northwestern French sources plus one southern one, and ask it to fit the Quebecois. With Haute-Garonne as the southern source it returns 49.9 per cent southern French. Half the ancestry of a population whose parish registers name Normandy, Aunis and Perche, apparently, from Occitan Toulouse.
Eight versions of the same proximal model, differing only in which southern French source is offered. The weight swings by fifty points and the fit distance does not move.
Swap the southern source and watch what happens. Auvergne takes 39.7 per cent. The Landes takes 16.9. Aveyron takes 11.9, Bearn 11.6, Herault 1.7, Marseille zero. Remove the southern source altogether and the model redistributes everything into Poitou-Aunis at 47.7, Anjou and Maine at 29.9 and Normandy at 22.4, which is roughly the historically correct answer, arrived at for entirely the wrong reason.
The diagnostic is in the fit distances. Across all eight of those models the fit runs between 8.8 and 9.3 units. The composition swings by fifty percentage points and the quality of the fit does not move at all. When that happens, the model is not choosing between the sources on the evidence; it is filling a residual with whatever happens to lie along it, and any source in the general direction will do.
The reason is visible in the pole separations. Poitou-Aunis and Haute-Garonne are 7.6 units apart. Normandy and Brittany are 9.7 apart. Paris and Nord-Picardy are 11.7 apart. The largest separation anywhere in the French panel is 35 units. Our working threshold for a two-source model, established across earlier articles on this site, is about 100 units, below which collinearity artifacts become serious. Every pair in this panel is between three and thirteen times below that threshold, and the condition number of 145.5 says the same thing in one number.
Global25 can tell you that a population is French. It cannot tell you which France, and no amount of source selection will change that, because the information is not in the coordinates.
The deep view
Move to a panel where the poles are hundreds of units apart and the model becomes stable and boring, which is exactly the point.
The same five-source panel applied to the French colonial populations of North America, to the regions of France, and to their northwest European neighbours.
The Quebecois come out at 47.9 per cent Anatolian Neolithic, 12.9 per cent western hunter-gatherer and 39.2 per cent steppe. Acadians return 48.2, 12.8 and 39.0. Cajuns return 47.9, 12.2 and 39.9. The HGDP French average returns 49.1, 10.9 and 40.0. These are the same profile to within model noise.
The rows below them show the panel is not blind: it resolves the northwest European gradient perfectly well. Brittany at 41.4 Anatolian and 46.0 steppe, English at 39.6 and 47.5, Irish at 36.6 and 50.7, Anglo-Newfoundlanders at 39.9 and 47.3, sitting exactly where their British and Irish ancestry says they should. The instrument works. It simply has nothing to say about the difference between a Frenchman and a Quebecois, because on this axis there is no difference to report.
The Indigenous question
No article about French Canadian ancestry can avoid this one, because the belief that every Quebecois family has an Indigenous ancestor somewhere is close to universal in Quebec and, in a specific and limited sense, it is nearly true.
Genealogically, a large fraction of Quebecers do descend from at least one Indigenous founder, because a small number of Indigenous women who married French settlers in the seventeenth century have enormous numbers of living descendants. That is a statement about pedigrees. The autosomal statement is different, and it was settled in 2013, when Claudia Moreau and colleagues estimated Indigenous ancestry in the Quebec founder population at about one per cent using three independent methods.
An ancient Wendat pole in a five-source model. The Metis row confirms the model would see a real contribution; the French colonial rows return zero.
Our model returns zero. Offered a five-source panel of French, Irish, German, an ancient Wendat individual from southwestern Ontario and a West African source, the Quebecois average takes 0.00 per cent Wendat. So do the Acadians of the Maritimes and New Brunswick, the Cajuns and Creoles of Louisiana, the Anglo-Newfoundlanders and the Belgian control. The three-person Quebecois average takes 0.40 per cent, which is noise. Substituting a 400-year-old Mi'kmaq individual from Atholville for the Wendat changes nothing.
The model is not blind. The Metis-mixed sample from Newfoundland and Labrador takes 9.1 per cent on the identical panel, and a European-admixed Algonquin sample takes 75.4 per cent. The French to Wendat pole separation is 613 units, which is six times the threshold at which we start trusting a two-source decomposition. If there were a large Indigenous component here, this model would see it.
The question is how small a contribution it could see, and that has to be measured rather than assumed.
Synthetic Quebecois genomes built by adding a known amount of Wendat ancestry to the real average, then pushed back through the same model.
Synthetic genomes were built by adding a known amount of Wendat ancestry to the real Quebecois average and pushing each one back through the same model. Inject half a per cent and the model reports zero. Inject one per cent and it reports 0.29. Inject two and it reports 1.30, three and it reports 2.31, five and it reports 4.32, ten and it reports 9.36. Recovery becomes linear and close to one to one above about two per cent, and collapses below one.
So the honest reading is this. The published figure of about one per cent Indigenous ancestry sits precisely on the detection floor of this method. Our zero is not evidence against it; it is what one per cent looks like on an instrument that cannot resolve one per cent. Anyone reporting a Global25 result showing five or ten per cent Indigenous ancestry in an ordinary Quebecois profile is reporting an artifact, because the method would have recovered a real five per cent as 4.3 and a real ten per cent as 9.4, and it does not.
What thirteen units actually means
The central number of this article is that the Quebecois sit 13.3 units from the French average. It is worth putting that number on a scale with the things it should be compared against.
The Quebecois to France gap set against the things it should be compared with: sampling error, within-population scatter, and the distance between two averages of the same population.
The Quebecois sit closer to the Acadians of the Maritimes, at 3.3, than any two French regional samples sit to each other. They sit 13.3 from the French average, which is less than the 14.2-unit median error of a three-person sample and considerably less than the 22-unit gap between the two available Quebecois averages of the same population. They sit at roughly half the distance that separates a typical individual Frenchman from his own regional average.
That last comparison deserves to be stated as bluntly as possible. Of the 260 individually genotyped French people in this dataset, not one sits as close to the mean of his own region as the entire Quebecois population sits to the mean of France. Every single one is further away.
Four hundred years, an ocean, three nested bottlenecks, an effective founder number in the low hundreds, and the population has moved less far from its source than one randomly chosen Frenchman is from his neighbours.
What the founder effect did do
Meanwhile, at individual loci, the same history did something spectacular.
What the three founder effects actually produced. Enrichment of each regional founder allele over its frequency in the global reference database.
The PEX6 deletion responsible for Zellweger syndrome in the region is roughly nine hundred times more common there than in the global reference database. The Andermann syndrome deletion in SLC12A6 is roughly seven hundred times more common, the vitamin D rickets frameshift in CYP27B1 six hundred, the Leigh syndrome variant in LRPPRC four hundred, the spastic ataxia deletion in SACS three hundred and fifty. Even tyrosinemia, the mildest enrichment in the group because the splice variant is not especially rare elsewhere, runs at seventy-five times the global frequency.
These are the same three founder effects, measured on a different instrument. Nothing has been added to the population and nothing has been removed. What has happened is that a handful of alleles carried by a handful of seventeenth-century immigrants, concentrated by six hundred settlers in Charlevoix and then surfed north on an expanding frontier by families whose fertility was both high and heritable, are now carried by two or three per cent of a region of 279,000 people.
Why the two measurements disagree
They do not, in fact, disagree. They are measuring different things, and the difference is the most useful idea in this article.
Genetic drift changes allele frequencies. In a small population it changes them a great deal, and it changes them in a random direction at every locus independently. An allele that happened to be carried by one influential founder family rises; an allele carried by nobody who reached the wave front disappears. Over twelve generations and an effective founder number in the hundreds, individual loci move by factors of hundreds, which is exactly what the chart above shows.
A Global25 coordinate is not an allele frequency. It is a projection of the whole genome onto twenty-five axes extracted from a principal component analysis of hundreds of thousands of markers. Every one of those axes is a weighted sum over the entire set. Because drift pushes each locus in an independent random direction, the pushes very largely cancel when you sum over the set, and what survives in the sum is proportional to one over the square root of the number of markers. A founder effect that multiplies a specific allele by nine hundred moves the population average by an amount that is, on this scale, close to nothing.
What the twenty-five axes do capture, and capture very well, is ancestry composition: how much of a genome descends from Anatolian farmers, from steppe pastoralists, from Indigenous North Americans, from West Africans. Those quantities are systematic rather than random. They do not cancel in the sum. They are the reason a Cajun with a Louisiana Creole grandmother shows up immediately, and the reason a Metis sample from Newfoundland reads 9.1 per cent on an Indigenous pole.
The founder effect at Saguenay-Lac-Saint-Jean did not change anybody's ancestry composition. Every founder was French, and the ones who were not were mostly Irish or Scottish and arrived in numbers too small to shift the mean. What it changed was which particular copies of which particular genes got passed on. That is invisible to a calculator built to answer a completely different question, and it is the reason a person from Chicoutimi can run a Global25 model, see nothing unusual, and still have a one in twenty chance of carrying a tyrosinemia allele.
There is a general lesson in this, and it applies far beyond Quebec. Global25 and the tools built on it measure admixture, not relatedness and not drift. Ashkenazi Jews, Finns, Sardinians and Icelanders all show up as distinctive on this kind of analysis, and it is tempting to conclude that the method detects founder populations. It does not. It detects their ancestry, which in each of those cases happens to be unusual for their geography. Where a founder population is drawn cleanly from one source, as the Quebecois were drawn from northwestern France, the method sees a slightly averaged version of the source and nothing else, no matter how severe the bottleneck was.
Limits
Five caveats, and the first two are serious. The Quebecois average used throughout rests on a collection that includes simulated individuals; the three-person average from the collection without them agrees on every qualitative conclusion but sits 22 units away, and no result in this article should be quoted to better than about ten units of precision. Second, none of these samples is specifically from Saguenay-Lac-Saint-Jean. Global25 has no Saguenay, no Charlevoix and no Beauce; the regional structure that Anderson-Trocme and colleagues resolved in 2023 using a four-million-record pedigree and twenty thousand genotypes is entirely beyond the reach of a twenty-five dimensional summary, and every statement here about the Saguenay specifically rests on the published literature rather than on our own modelling.
Third, the French regional reference set is thin and unevenly distributed, with thirty-seven individuals from Haute-Garonne and one from Orne, which is close to the opposite of what this particular question needs. Fourth, the Indigenous result is a null at the detection floor and should be read as consistent with the published one per cent rather than as an independent confirmation of it. Fifth, the enrichment factors in the last chart are derived from published carrier rates and reference database frequencies rather than measured directly, and are order of magnitude figures.
Conclusion
The Quebecois are a French population. On every axis that Global25 measures they are the northwest of France, lightly averaged, with a few points of British Isles input from the two centuries after the conquest and an Indigenous contribution of about one per cent that sits below what this method can resolve. Their nearest relatives on earth are the Acadians and the Cajuns, which is the one place where four hundred years of separate demographic history shows up as a clean genetic signal.
Everything that makes Saguenay-Lac-Saint-Jean famous is invisible here. Six hundred settlers in Charlevoix, thirty thousand migrants into the Saguenay, a moving frontier that rewarded large families with more large families, and a set of alleles now running at three hundred to nine hundred times their global frequency: none of it moves the population average by as much as one Frenchman differs from his own neighbours.
That is not a failure of the method. It is a precise statement about what a founder effect is. It is not a change of ancestry. It is a change of luck, applied one locus at a time, and it is measured in clinics rather than in calculators.
Quebecois_pooled_n157,0.132422,0.146023,0.055607,0.024501,0.043494,0.009413,0.001057,0.004209,0.012050,0.017336,-0.004178,0.005777,-0.012373,-0.008687,0.010766,0.001261,-0.003067,0.000186,-0.000693,0.000649,0.003048,0.001476,-0.001395,0.002679,-0.000372
Quebecois_n3,0.127103,0.140143,0.049780,0.020780,0.039700,0.009947,-0.000078,0.002077,0.013908,0.016280,-0.005954,0.001648,-0.011199,-0.005138,0.013572,-0.005834,-0.014820,0.001562,0.002556,-0.005711,-0.002371,0.002638,-0.005793,0.003655,0.003512
Acadian_Maritimes_n36,0.132619,0.144918,0.055261,0.024244,0.043213,0.008235,0.000187,0.003062,0.011559,0.018328,-0.004610,0.005734,-0.012714,-0.007612,0.009855,0.001056,-0.001726,0.000142,-0.000624,0.000741,0.002985,0.000946,-0.001225,0.002426,0.000123
Cajun_Louisiana_n8,0.131085,0.143013,0.052864,0.024353,0.043012,0.009502,0.001615,0.002882,0.011731,0.018848,-0.003699,0.005903,-0.016226,-0.010870,0.011829,0.004857,-0.002362,0.001236,0.003583,0.001485,0.003419,0.001294,-0.001373,0.006829,-0.000264
France_Normandy_pooled_n33,0.129138,0.138574,0.056500,0.034943,0.040558,0.013015,0.001852,0.005000,0.007871,0.008217,-0.004040,0.004991,-0.011478,-0.009217,0.015785,0.004697,-0.004488,0.001885,0.001413,0.002710,0.004976,0.003058,-0.001449,0.010257,-0.002025
France_Poitou_Aunis_Vendee_pooled_n10,0.126799,0.146541,0.050119,0.017442,0.044254,0.003904,-0.001434,0.003300,0.013376,0.022579,-0.005765,0.007104,-0.013796,-0.012262,0.011563,0.001485,-0.005685,0.001495,-0.000138,-0.000250,0.002308,0.004736,-0.001984,0.005049,-0.001162
France_Anjou_Maine_pooled_n5,0.127709,0.137706,0.053928,0.029781,0.043331,0.009928,0.001927,0.005077,0.013908,0.017422,-0.004027,0.005006,-0.014628,-0.011120,0.012459,0.002042,-0.005476,0.001495,0.001031,0.001100,0.002346,0.000915,-0.000912,0.003808,-0.000790
France_Nord_Picardy_pooled_n51,0.127727,0.140362,0.051466,0.025713,0.038873,0.009586,0.002129,0.004394,0.008506,0.012338,-0.003948,0.004381,-0.011514,-0.009035,0.012470,0.001497,-0.005926,0.002713,0.003167,0.000103,0.002253,0.001910,-0.001177,0.007979,-0.000509
France_Paris_n11,0.127171,0.141436,0.050431,0.023990,0.040903,0.009305,0.002799,0.005454,0.011602,0.018174,-0.007706,0.006812,-0.012907,-0.010384,0.013770,0.006063,-0.001826,0.004664,0.002708,-0.000978,0.002201,0.003575,-0.001233,0.011141,-0.001905
France_Brittany_n40,0.131466,0.138340,0.057850,0.039285,0.039169,0.015813,0.003155,0.004211,0.008186,0.009490,-0.005131,0.005590,-0.014368,-0.013102,0.018343,0.004399,-0.007302,0.001280,-0.000462,0.001773,0.004467,0.001787,-0.001254,0.010547,0.000659
France_Haute-Garonne_Occitan_n37,0.127020,0.144864,0.048914,0.017459,0.043542,0.003573,0.000400,0.003861,0.014952,0.023725,-0.003261,0.006659,-0.015019,-0.009477,0.010597,0.002587,-0.003570,0.002342,0.001291,-0.000081,0.003575,0.002420,-0.002555,0.001752,0.000482
Turkey_N,0.117902,0.180087,0.003426,-0.101059,0.051240,-0.047969,-0.003799,-0.006846,0.036167,0.080678,0.008261,0.011309,-0.024164,0.000579,-0.042712,-0.010370,0.022556,0.001388,0.013649,-0.010448,-0.014261,0.005693,-0.004904,-0.003750,-0.004436
Luxembourg_Loschbour_WHG,0.130897,0.109677,0.203645,0.198000,0.162492,0.059125,0.015041,0.038075,0.100217,0.016219,-0.015427,-0.017235,0.019921,-0.001239,0.061346,0.070670,0.002608,0.007348,-0.008925,0.065406,0.117543,0.010387,-0.049422,-0.173639,0.019519
Russia_Samara_EBA_Yamnaya,0.125838,0.089254,0.042908,0.115456,-0.027868,0.044685,0.004491,-0.002949,-0.054858,-0.072996,0.001858,0.000350,-0.001652,-0.023610,0.037263,0.015734,0.000000,-0.001478,-0.001704,0.012506,-0.003120,0.001374,0.011229,0.018436,-0.004524
Iran_GanjDareh_N,0.043025,0.067431,-0.153488,0.005556,-0.123962,0.024375,0.015464,0.000277,-0.081605,-0.054270,-0.003248,-0.001619,0.005382,-0.007845,0.031949,0.056775,-0.005815,0.007576,0.014405,-0.032741,0.007661,-0.030048,-0.010920,-0.038777,0.022944
Nganasan,0.044992,-0.411402,0.155635,0.000350,-0.160996,-0.090190,0.028671,0.041300,0.029406,0.013354,0.101939,0.009100,-0.004018,-0.026580,-0.020354,-0.010464,0.001934,0.013971,0.025496,-0.000886,0.042481,-0.012956,0.032291,0.000321,0.013000
Canada_Teston_Road_500BP_Wendat,0.052359,-0.308721,0.108988,0.094639,-0.095710,-0.006693,-0.235481,-0.275065,-0.024543,-0.021686,0.003410,0.000000,0.003717,0.009083,-0.003936,0.008618,-0.007953,0.001267,-0.006536,-0.010130,-0.003619,0.007543,0.006039,0.004940,-0.001437
Global25 coordinates by Davidski (Eurogenes). Population averages from the Moriopoulos Collection 2026. Models can be reproduced in Vahaduo using the blocks above.
References
- 1990 De Braekeleer M., Larochelle J. Genetic epidemiology of hereditary tyrosinemia in Quebec and in Saguenay-Lac-St-Jean. American Journal of Human Genetics 47(2): 302-307.
- 1993 De Braekeleer M., Giasson F., Mathieu J., Roy M., Bouchard J.P., Morgan K. Genetic epidemiology of autosomal recessive spastic ataxia of Charlevoix-Saguenay in northeastern Quebec. Genetic Epidemiology 10(1): 17-25.
- 1996 De Braekeleer M., Gauthier S. Autosomal recessive disorders in Saguenay-Lac-Saint-Jean (Quebec, Canada): a study of inbreeding. Annals of Human Genetics 60(1): 51-56.
- 1998 Austerlitz F., Heyer E. Social transmission of reproductive behavior increases frequency of inherited disorders in a young-expanding population. PNAS 95(25): 15140-15144.
- 2000 Charbonneau H., Desjardins B., Legare J., Denis H. The population of the St-Lawrence Valley, 1608-1760. In: A Population History of North America, Cambridge University Press: 99-142.
- 2001 Scriver C.R. Human genetics: lessons from Quebec populations. Annual Review of Genomics and Human Genetics 2: 69-101.
- 2005 Laberge A.-M., Michaud J., Richter A., Lemyre E., Lambert M., Brais B., Mitchell G.A. Population history and its impact on medical genetics in Quebec. Clinical Genetics 68(4): 287-301.
- 2008 Tremblay M., Vezina H. Distant kinship and founder effects in the Quebec population. In: Kinship and Demographic Behavior in the Past, Springer.
- 2011 Bherer C., Labuda D., Roy-Gagnon M.-H., Houde L., Tremblay M., Vezina H. Admixed ancestry and stratification of Quebec regional populations. American Journal of Physical Anthropology 144(3): 432-441.
- 2011 Roy-Gagnon M.-H., Moreau C., Bherer C., St-Onge P., Sinnett D., Laprise C., Vezina H., Labuda D. Genomic and genealogical investigation of the French Canadian founder population structure. Human Genetics 129(5): 521-531.
- 2011 Moreau C., Bherer C., Vezina H., Jomphe M., Labuda D., Excoffier L. Deep human genealogies reveal a selective advantage to be on an expanding wave front. Science 334(6059): 1148-1150.
- 2012 Mathieu J., Prevost C. Epidemiological surveillance of myotonic dystrophy type 1: a 25-year population-based study. Neuromuscular Disorders 22(11): 974-979.
- 2013 Moreau C., Lefebvre J.-F., Jomphe M., Bherer C., Ruiz-Linares A., Vezina H., Roy-Gagnon M.-H., Labuda D. Native American admixture in the Quebec founder population. PLoS ONE 8(6): e65507.
- 2018 Tardif J., Pratte A., Laberge A.-M. Experience of carrier couples identified through a population-based carrier screening pilot program for four founder autosomal recessive diseases in Saguenay-Lac-Saint-Jean. Prenatal Diagnosis 38(1): 67-74.
- 2021 Bchetnia M., Bouchard L., Mathieu J., Campeau P.M., Morin C., Brisson D., Laberge A.-M., Vezina H., Gaudet D., Laprise C. Genetic burden linked to founder effects in Saguenay-Lac-Saint-Jean illustrates the importance of genetic screening test availability. Journal of Medical Genetics 58(10): 653-665.
- 2022 Labuda D., Harding T., Milot E., Vezina H. The effective family size of immigrant founders predicts their long-term demographic outcome. PLoS ONE 17(4): e0266079.
- 2023 Anderson-Trocme L., Nelson D., Zabad S., Diaz-Papkovich A., Kryukov I., Baya N., Touvier M., Jeffery B., Dina C., Vezina H., Kelleher J., Gravel S. On the genes, genealogies, and geographies of Quebec. Science 380(6647): 849-855.