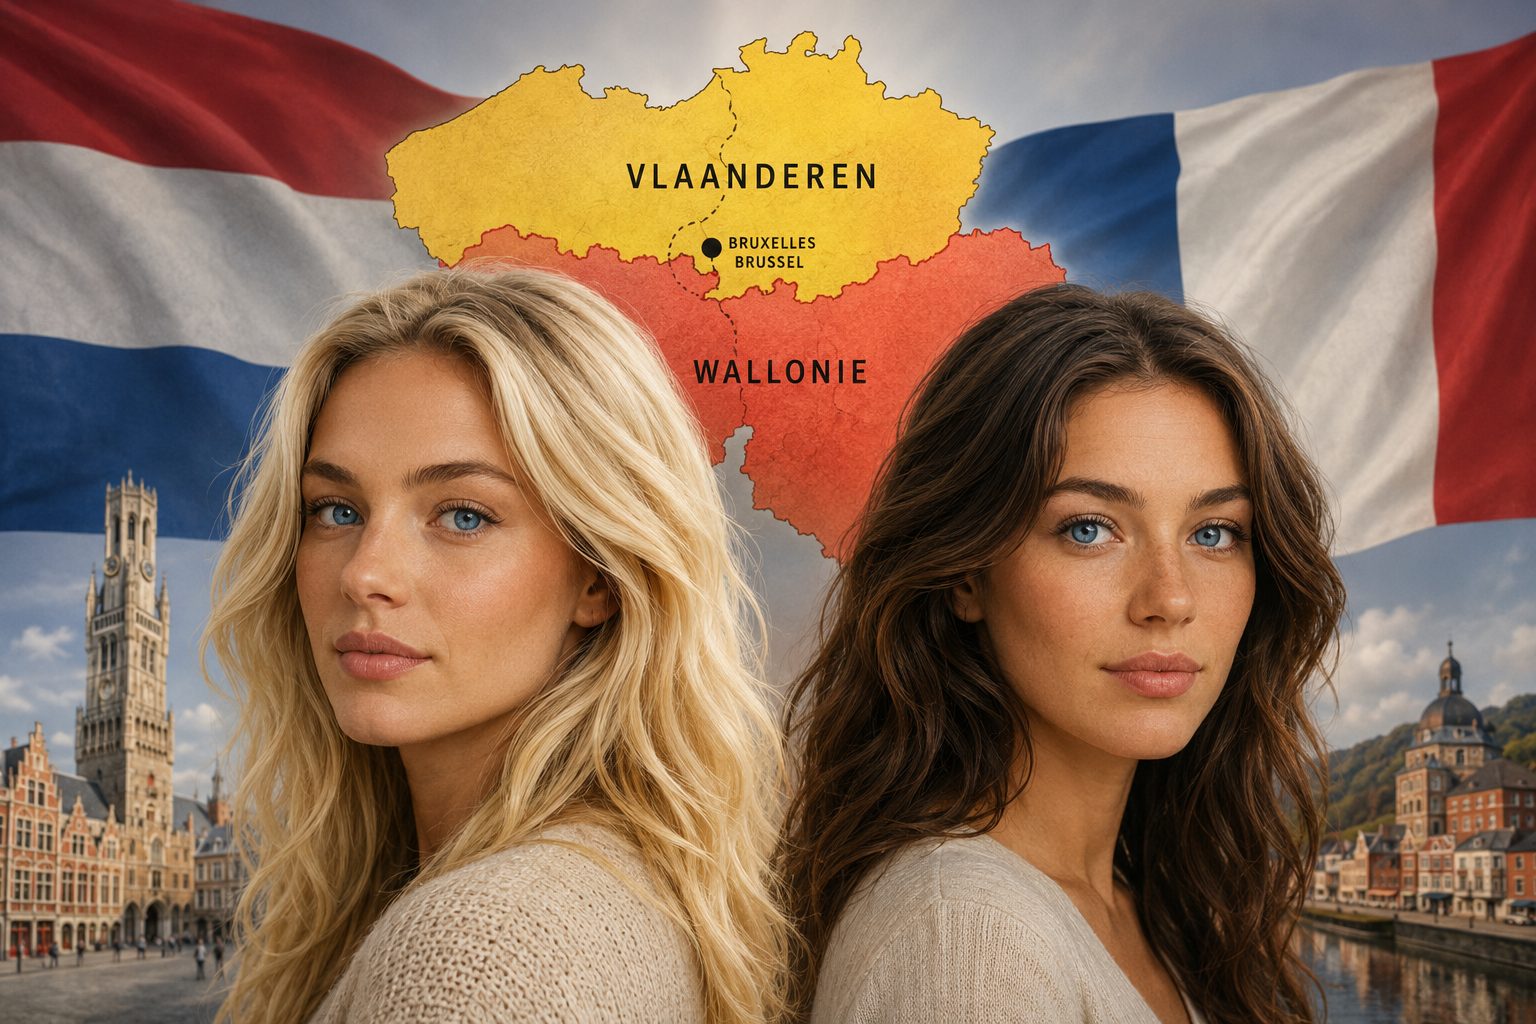
Belgium is built around a border you cannot see on the ground. The language line splits Dutch-speaking Flanders in the north from French-speaking Wallonia in the south, with bilingual Brussels in between. It decides which school a child attends, which party governs a town, and which newspaper lands on the doormat. The obvious question for anyone holding a DNA test is simple: does that line correspond to anything in the genome? And what about the Nord of France, once part of the great medieval county of Flanders, and the southern reach of present-day Wallonia? Ancient and modern DNA now give a clear, and slightly surprising, answer.
Key points
- The Flemish-Walloon line is a linguistic and political border, broadly stable since the early Middle Ages, but it is not a genetic frontier.
- Flanders, Wallonia, the Netherlands and northern France sit on one shallow gradient running between a North Sea Germanic pole and a Gaulish continental pole (Beneker et al. 2025).
- The Belgian average is closer to French Hauts-de-France (about 6 G25 units) than to the Netherlands (about 24). National and language borders cut across the gradient rather than breaking it.
- At the deep level (hunter-gatherer, early farmer, steppe), Flemish, Walloons and northern French are indistinguishable. The gradient is a thin, recent overlay on a shared foundation about 4,500 years old.
- French Flanders is a continuation of Belgian Flanders. DNA does not see the France-Belgium border.
1. A border that language drew, not blood
The Belgian language frontier is real, but it is a frontier of words. It took shape in the early medieval centuries as the boundary between zones where Romance speech (the ancestor of Walloon and French) and Germanic speech (the ancestor of Dutch and Flemish) became dominant. Over a thousand years it has barely moved. It is tempting to read such an old, stable line as the edge between two separate peoples. The genetic record does not support that reading. What it shows instead is a single population spread across a gentle slope, with the language line sitting somewhere on the slope rather than at a cliff.
2. One foundation under the whole region
Long before anyone spoke Dutch or French, the lands that became Belgium, the Netherlands and northern France shared a common genetic foundation. The Mesolithic foragers of the Meuse caves gave way, after about 5000 BCE, to early farmers, and then to people carrying steppe-derived ancestry from around 2500 BCE. A 2026 study led by David Reich showed that this last transition in the Lower Rhine and Meuse area was unusual: a lasting layer of local forager ancestry, passed on largely through women, was folded into the incoming Bell Beaker population rather than erased by it (Reich et al. 2026; preprint 2025). The result is a regional substrate that is roughly 4,500 years old and shared right across the area, long predating any language line.
When we model present-day populations with a deep three-way mix of Western hunter-gatherer, early Anatolian farmer and steppe ancestry, the Flemish, the Walloons and the northern French come out essentially identical: each is about one tenth hunter-gatherer, a little under half early farmer, and a little under half steppe. The only structure at this depth is a faint, continuous gradient (very slightly more steppe in the north, very slightly more early-farmer in the south) that is shared by the whole of northwestern Europe. There is no ancient divide to be found.
3. Gauls before the border
The Iron Age peoples that Caesar called the Belgae and the Galli were not a patchwork of genetically distinct tribes. Archaeogenomic work on Iron Age France (Fischer et al. 2022) found no break between Bronze Age and Iron Age groups and a striking genetic homogeneity across regions, knit together by mobility and gene flow with Britain and Iberia. In our own measurements the northern Gaul Iron Age (La Tene) sits very close to the British Iron Age (about 14 G25 units apart): Gauls and Britons were close kin. The Gallo-Roman inhabitants of Belgium continue this picture. Individuals from Pommeroeul and Tongeren, sampled from Roman-era contexts, already fall close to the medieval and modern range, with the Tongeren group only about 22 to 40 units from the modern Dutch, Belgian and northern French averages.
4. The Frankish input and the birth of the gradient
The gradient we see today was assembled in the migration period and the Middle Ages. On the Flemish coast, the late Merovingian cemetery of Koksijde (Sasso et al. 2024) held two groups buried together: a larger one whose ancestry matched the North Sea world of early medieval England and Holland (Germanic in origin), and a smaller one descended from the local Gauls of the interior. Two ancestries, fusing in one community. Inland at Sint-Truiden, the largest ancient-DNA study ever run on a single cemetery (Beneker et al. 2025) found that early medieval Flanders was far more diverse than today, with internal differences almost as large as those between modern Belgians and Spaniards, including a handful of individuals with Irish or Scottish profiles. Over the following centuries that diversity narrowed. As the team put it, the structure of the Low Countries today is the product of a slow, centuries-long blending of two ancestral ingredients, one Gaulish and one Germanic. That blending even left visible traces: people with more Germanic ancestry more often carried red-hair variants, while those with more Gaulish ancestry more often carried a variant tied to higher vitamin D levels.
5. The modern test: distances across the border
If the language line were a genetic frontier, populations on either side of it should be clearly separated, and they should each be closer to their own side than to anyone across the line. They are not. The table below gives Euclidean distances in scaled G25 units (multiplied by 1000) between reference groups from the Moriopoulos 2025 collection on Davidski Global25 coordinates.
| Dutch | Belgian | Fr. Nord | English | German | Fr. South | |
|---|---|---|---|---|---|---|
| Dutch (n=167) | 0 | 24.0 | 28.8 | 8.5 | 17.0 | 52.2 |
| Belgian (n=311) | 24.0 | 0 | 6.1 | 22.0 | 19.5 | 29.9 |
| Fr. Hauts-de-France (n=37) | 28.8 | 6.1 | 0 | 26.7 | 23.2 | 26.5 |
| English (n=44) | 8.5 | 22.0 | 26.7 | 0 | 19.7 | 48.9 |
| German (n=101) | 17.0 | 19.5 | 23.2 | 19.7 | 0 | 46.6 |
| Fr. South / Occitan (n=140) | 52.2 | 29.9 | 26.5 | 48.9 | 46.6 | 0 |
The headline figure is the 6.1 between the Belgian average and French Hauts-de-France: across the France-Belgium national border, two populations are almost on top of each other. The Belgian average is in fact four times closer to northern France than to the Netherlands. Internal scatter within Belgium itself (the spread among three separate Belgian sample sets) runs at about 10 to 16 units, the same order as the gap between countries. The big axis of variation is not any border at all; it is the slow drift from the North Sea coast down toward the Mediterranean, with the full span (Dutch to southern French) reaching about 52 units.
A caution on the small samples. Public Global25 labels for Walloon (n=1) and Flemish from Belgium (n=2) are far too small for a direct Flemish-versus-Walloon comparison: a single individual carries too much personal noise. For the contrast across the language line we therefore lean on the robust anchors above and on the published qpADM-calibrated results of the Sint-Truiden team, which describe the Flemish-Walloon difference as a position on the Germanic-Gaulish gradient rather than a discontinuity.
6. Everyone on the same gradient
Placing each modern group between a Gaulish pole (northern Gaul Iron Age) and a North Sea Germanic pole (early medieval northwestern Germany and Frisia) makes the gradient explicit. The Dutch sit closest to the Germanic pole; the Flemish a step in from there; the Belgian average, the Walloons and northern France lean toward the Gaulish pole; southern France pulls away toward a Mediterranean direction that neither northern pole captures.
A two-source Gaulish-plus-Germanic model captures the direction of this slope but not precise fractions, because the two poles overlap heavily (both are northwestern European) and the model leaves a real residual. Adding a southern Mediterranean reference improves the fit and shows the pattern cleanly: the North Sea Germanic share peaks in the Netherlands and Flanders and falls away to the south, while the southern component rises in the same direction. The numbers below are best read as approximate directions, not exact ancestry percentages.
The third ingredient here is a southern or Mediterranean proxy (an Iberian reference standing in for a broadly Neolithic-rich, southern-shifted component); it is not a literal record of Spanish migration into Flanders. What matters is the shape: a single smooth slope, with the Flemish and Walloon points only a short way apart on it, and with no step at the language line.
7. Northern France: Flanders did not stop at the modern border
The medieval county of Flanders reached well into what is now France, around Lille, Dunkirk and the Nord. That history is still legible in the genome. French Flanders profiles and the broader French Hauts-de-France sit right in the Belgian range; the modern political border between France and Belgium is, if anything, even less visible to DNA than the internal language line. The langue d'oil north of France grades smoothly into Belgium, while the deeper contrast within France itself is the familiar north-to-south one: the northern French sit near the Belgians, and the Occitan-speaking south sits about 27 to 30 units away, pulled toward the Mediterranean. The borders that organise daily life simply do not coincide with the lines the genome draws.
8. One cemetery, two worlds
The Sint-Rombout parish cemetery in Mechelen makes the point in miniature. Used from the tenth to the eighteenth century, it sat next to one of Europe's first permanent military hospitals, which served the Army of Flanders of the Spanish Netherlands. A 2024 Cell Genomics study of the site found, alongside a majority of local people, several individuals of Mediterranean ancestry, most plausibly soldiers and recruits drawn from southern Europe.
The individual you flagged, STR216, is a textbook local. It sits closest to the Northwest-European cluster of its own cemetery (about 18 units) and falls right in the middle of the gradient, almost exactly between the Gaulish and Germanic poles. It is nowhere near the Iberian and eastern Mediterranean profiles from the same ground: STR216 is about 79 units from the cemetery's Iberian group and about 122 from its eastern Mediterranean group. Two worlds in one churchyard: the local population living quietly on the cline, and a thin scatter of long-distance arrivals from the Spanish military world who left little or no mark on the surrounding gene pool. The Dutch Y-chromosome study (de Knijff and Altena 2025) reaches a parallel conclusion for the wider region: regional patterns mostly formed recently and owe a great deal to drift, so we should resist reading every local difference as the fingerprint of a named historical event.
9. So, is the frontier real?
Yes and no, and the distinction is the whole point. The linguistic and political frontier is entirely real, and it has shaped Belgian life for over a millennium. It even sits near a faint genetic gradient, because the north of the country leans slightly more toward the North Sea Germanic pole and the south slightly more toward the Gaulish pole. But it is a gradient, not a wall. It does not break at the language line; it runs straight through it and keeps going, north into the Netherlands and south and west into France. Flemings and Walloons are, genetically, two neighbouring points on one continuous slope, far closer to each other than either is to the southern edge of that same slope. The map of how people speak and vote in Belgium is a map of history. It is not a map of the genome.
The story in six steps
Claim and reality
The language border is an old ethnic and racial boundary between two peoples.
It is a linguistic and political line, broadly stable since the early Middle Ages. Genetically there is no break across it: the variation is a smooth gradient that runs straight through Belgium and keeps going into the Netherlands and into France.
Flemings are Germanic and Walloons are Gauls or Celts, two separate stocks.
Both sit on the same Germanic-to-Gaulish gradient, only at slightly different points. Flemish and Dutch profiles lean a little more toward the North Sea Germanic pole; Walloon and southern Belgian profiles lean a little more toward the Gaulish pole. The shift is small next to the full span of the gradient.
The France-Belgium national border separates different gene pools.
It does not. The Belgian average sits closer to French Hauts-de-France (about 6 G25 units) than to the Netherlands (about 24). French Flanders is a continuation of Belgian Flanders, exactly as the medieval county of Flanders would suggest.
The two groups have always been deeply, anciently distinct.
At the level of hunter-gatherer, early-farmer and steppe ancestry, Flemish, Walloon and northern French are indistinguishable. The gradient is a thin and recent overlay, mostly built in the Frankish and medieval centuries, on a shared foundation roughly 4,500 years old.
Reproduce it yourself
Paste the coordinates below into Vahaduo (the Global25 tool by Piotr Kapuscinski) to rebuild the comparisons in this article: the two ancestral poles, the Belgian ancient trajectory from Gallo-Roman Tongeren through Merovingian Koksijde, Sint-Truiden and Sint-Rombout, the Sint-Rombout Iberian outliers, the modern groups on either side of the border, and the STR216 individual. Coordinates are scaled Global25 from Davidski, drawn from the Moriopoulos 2025 collection (with STR216 as provided).
France_IA2_La_Tene_Grand_Est_(Northwest_Euro_Profile)_(n=7),0.12796986,0.13390486,0.062117143,0.046189,0.040930714,0.010996286,0.0045321429,0.0053072857,0.0060187143,0.0074195714,-0.0021574286,0.0067652857,-0.011680571,-0.0093191429,0.015782429,-0.0036557143,-0.0095365714,0.002588,0.002532,0.0035552857,0.0051694286,0.0018371429,0.000088,0.00087785714,-0.000017142857
Germany_Early_Medieval_Drantum_(n=16),0.11062181,0.12973387,0.058830812,0.051074375,0.040238188,0.019626938,-0.0000735,0.0081343125,0.0040010625,-0.0028018125,-0.005379125,0.0060976875,-0.0098023125,-0.01143125,0.023530563,0.008021625,-0.0054518125,-0.0001266875,0.004894375,0.00362675,0.0086331875,0.005664875,0.0016483125,0.015212937,0.001175
Belgium_Early_Medieval_Merovingian_Koksijde_(Northwest_Euro_Profile)_(n=12),0.12264425,0.1354885,0.059239417,0.040025083,0.039699667,0.015757167,0.0035838333,0.0041920833,0.010072917,0.00604425,-0.00385675,0.0033095,-0.011137333,-0.01119325,0.018887833,0.0085409167,-0.0046719167,-0.00046441667,0.00575075,0.0047835833,0.0066445833,0.0035136667,0.0013865,0.010744333,-0.00052891667
Belgium_Early-High_Medieval_Sint-Truiden_(Mixed_Western_Euro_Profile)_(n=7),0.12325429,0.13753186,0.050695714,0.026439857,0.037281571,0.0098808571,0.0053381429,0.0052744286,0.0082687143,0.010127,-0.0039901429,0.0080072857,-0.0083887143,-0.010439714,0.011303571,0.010872429,0.00083814286,-0.00092314286,-0.000036142857,0.0019472857,0.0044385714,0.0031972857,0.001514,0.0069198571,-0.0011631429
Belgium_High-Late_Medieval_St._Rombout's_(Northwest_Euro_Profile)_(n=8),0.12235988,0.13328825,0.056803875,0.039607875,0.038237875,0.012794125,0.005316875,0.0084515,0.0047295,0.003439875,-0.0073075,0.007081375,-0.0086595,-0.01187,0.018475,0.01112075,0.00356925,0.000586125,0.000817,0.00734725,0.00364975,0.0060435,0.002711375,0.0132095,-0.000553875
Belgium_Late_Medieval-Early_Modern_St._Rombout's_(Iberian_Profile)_(n=4),0.1013025,0.14699775,0.0347895,-0.004522,0.036776,-0.00620525,-0.006874,0.00051925,0.0247985,0.0268345,-0.002842,0.00835525,-0.01230175,-0.0062275,0.010213,-0.0088835,-0.01193,-0.00250225,-0.00270225,-0.00512775,0.00268275,-0.0029365,-0.000986,-0.00247025,0.0016465
Belgium_Roman_Empire-Late_Antiquity_Tongeren_(n=2),0.124636,0.1330345,0.062036,0.048773,0.033237,0.0196615,0.006815,0.010038,0.0009205,0.0043735,-0.001218,0.0038965,-0.0140485,-0.016928,0.021919,0.005635,-0.006845,0.0020905,-0.0001885,0.0013755,0.0106065,0.0105725,-0.0080725,0.013375,0.005628
Dutch_(n=167),0.12747096,0.1341964,0.060274643,0.044085599,0.04083968,0.016408406,0.0053970655,0.0072534872,0.0042040271,0.001925043,-0.005639563,0.0044353374,-0.0098572849,-0.0086768842,0.017846962,0.0056341531,-0.0065177976,0.0017528756,0.0039090441,0.002817998,0.0044783527,0.0033782364,6.24E-07,0.013900481,-0.00065413756
Belgian_(n=311),0.12834561,0.14034229,0.051888627,0.027877704,0.039490836,0.010440929,0.0031653376,0.0047636367,0.0074089003,0.01053337,-0.0043082476,0.0055648553,-0.011699241,-0.0083286141,0.013138691,0.0030017717,-0.0048443344,0.0014139228,0.0022027588,0.00078773633,0.0033244952,0.0025470257,-0.00044463987,0.0088594244,-0.00018211254
Flemish_Belgium_(n=2),0.132035,0.136589,0.0533625,0.031654,0.0397,0.011016,-0.00141,0.0008075,0.006647,0.009385,-0.006983,0.007194,-0.0057235,-0.0096335,0.0133685,0.006298,-0.0065845,-0.004181,0.002891,-0.001188,0.0018715,0.0048225,0.00228,0.014761,-0.0008385
Walloon_(n=1),0.127482,0.141159,0.045632,0.024548,0.039392,0.006693,0.00047,0.002308,0.010635,0.017677,-0.007957,0.008093,-0.011001,-0.005367,0.011129,-0.009679,-0.021644,0.003294,0.004651,-0.000875,-0.001248,0.001978,-0.002465,0.00735,0.003353
Flemish_France_Nord_(n=3),0.127482,0.139466,0.055185333,0.038006333,0.041033333,0.013293667,0.0046216667,0.0059226667,0.0057263333,0.0059533333,-0.007903,0.0052453333,-0.0095143333,-0.015505333,0.019182,0.00853,0.004303,0.0010133333,0.0075,0.0021263333,0.0046586667,-0.0029676667,-0.0046426667,0.0080733333,-0.00463
French_Oil_Hauts-de-France_Nord_(n=37),0.12809714,0.1408567,0.051247676,0.024635297,0.037969595,0.0086757027,0.0014608108,0.0045715676,0.0081367027,0.012426568,-0.0038008378,0.0045162703,-0.011450892,-0.008740973,0.012273595,0.0012182973,-0.0058672973,0.0024960811,0.0033123514,0.00066586486,0.0017132703,0.0015672973,-0.00087943243,0.0080243514,-0.00025889189
Belgium_StRombout_Cemetery_Medieval:STR216,0.124067,0.129988,0.058831,0.036176,0.045855,0.015339,0.00564,0.00923,0.003272,0.005103,-0.00747,0.001499,-0.012042,-0.012386,0.010722,0.012463,0.011735,0.001014,0,0.004002,0.004367,0.004946,-0.002342,0.01217,0.000958
References and sources
- 1 Beneker, O., Kivisild, T., Larmuseau, M. H. D., et al. (2025). Urbanization and genetic homogenization in the medieval Low Countries: a ten-century paleogenomic study of Sint-Truiden. Genome Biology 26:127. link
- 2 Sasso, S., Tambets, K., Larmuseau, M. H. D., Kivisild, T., et al. (2024). Capturing the fusion of two ancestries and kinship structures in Merovingian Flanders (Koksijde). Cell Genomics / PNAS 121. link
- 3 Study of the Sint-Rombout parish cemetery, Mechelen (2024), Cell Genomics: medieval to early modern genomes, including individuals of Mediterranean ancestry linked to the early modern military hospital. link
- 4 de Knijff, P., Altena, E., et al. (2025). The Dutch Y-chromosome from the early Middle Ages to the present day. Archaeological and Anthropological Sciences 17:116. link
- 5 Reich, D., et al. (2026). Lasting Lower Rhine and Meuse forager ancestry shaped the Bell Beaker expansion. Nature. link
- 6 Lasting Lower Rhine and Meuse forager ancestry (2025), preprint version. bioRxiv 2025.03.24.644985. link
- 7 De Coster, M., Kootker, L. M., Vos, W. K., et al. (2026). The Roman military community as a melting pot: biomolecular evidence from the Lower Rhine limes (Valkenburg). Research Square preprint. link
- 8 Assembling ancestors: the manipulation of Neolithic and Gallo-Roman skeletal remains at Pommeroeul, Belgium (2025). Antiquity. link
- 9 Fischer, C.-E., et al. (2022). Origin and mobility of Iron Age Gaulish groups in present-day France revealed through archaeogenomics. iScience 25. link
Modern and ancient G25 coordinates: Davidski (Global25) and the Moriopoulos 2025 collection. Global25 spreadsheet tooling: Piotr Kapuscinski (Vahaduo). Analysis: scaled Global25 Euclidean distances and non-negative least squares modelling. STR216 coordinates as supplied.