
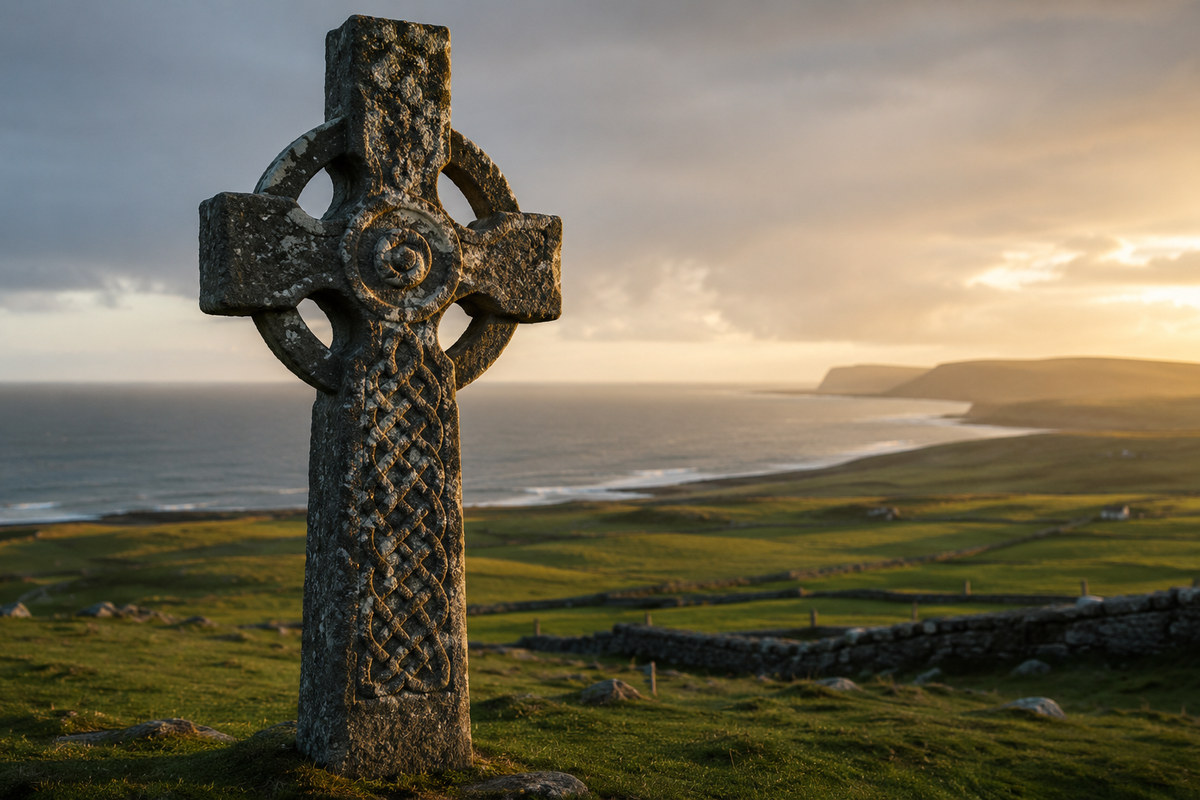
Somewhere around three thousand years ago a language began to spread west across Europe, and by the time anyone wrote it down its speakers occupied a band running from the Danube to the Atlantic. Today that language family survives in six places, all of them on the far western edge of the continent. The awkward fact, and the reason this article exists, is that those six places sit near the far end of any ranking of genetic distance from the Iron Age heartland where Celtic is supposed to have formed. Every Basque population, and the Basques have never spoken an Indo-European language of any kind, sits closer to Hallstatt than the Scots and the Irish do. This article takes that paradox seriously, measures it against 488 individually genotyped ancient genomes, and finds that it has two halves and one honest limit.
Three answers, and none of them was the obvious one
Where Celtic came from has been argued for a century and a half, and the arguments have mostly been about which archaeological culture to point at.
The oldest answer is Hallstatt, the salt mining site above the Salzkammergut in Upper Austria that gave its name to the Early Iron Age of central Europe, roughly 800 to 450 BC. Its successor, La Tene, named after a site on Lake Neuchatel, carries the art style that everyone recognises as Celtic. The reasoning was simple and for a long time looked unanswerable: the classical sources place Celts in central Gaul and the upper Danube, the material culture radiates from there, so the language must have radiated from there too.
The second answer, associated with Barry Cunliffe and John Koch, runs the arrow backwards. Celtic, on this account, formed along the Atlantic facade during the Bronze Age, in the maritime network that moved Irish copper and Cornish tin and Iberian metalwork up and down the western seaboard, and then spread inland. The evidence offered is the Tartessian inscriptions of southern Portugal and the observation that the Atlantic zone was a coherent exchange system for a millennium before Hallstatt existed.
The third answer, which has strengthened considerably since 2022, places the relevant expansion in the Late Bronze Age of central Europe, before Hallstatt, in the Urnfield horizon. That is the answer the genetics now supports, and it is also the answer that makes the paradox worse rather than better, which is why the rest of this article is mostly about the paradox.
The paradox, stated in numbers
Before any modelling, one measurement. Take the four best sampled Hallstatt cemeteries in the dataset, average them, and rank every living population in Davidski's modern averages file by distance from that average. Eighty nine populations fall within 0.052. The chart shows thirty of them, chosen by a stated rule rather than by hand: the ten closest, every Catalan and Basque group that a reader pointed out was missing from the first version, every population that still speaks a Celtic language, and the original comparison set. Each bar carries its rank in the full list, so the gaps are visible and the complete ordering can be reconstructed.
Global25 distance from a Hallstatt core average built from Gmunden in Austria, Magdalenenberg and the Heuneburg in Germany, and Bylany in Bohemia. Rank out of 89 is shown beside each name.
The top of the ranking is Gaul. French Occitanie at 0.0148, French Auvergne at 0.0163, the Belgians at 0.0187, the Swiss Germans at 0.0196, Paris and Alsace at 0.0209. Every one of those regions spoke a Celtic language in antiquity and every one of them lost it.
Then, before any Germanic or British population appears, comes the Mediterranean coast of Spain. Barcelona at 0.0293, central Catalonia at 0.0295, Penedes at 0.0303, Girona at 0.0316. All of them ahead of the Germans at 0.0341 and the Austrians at 0.0355. That coast was the Iberian language zone, non Indo European, and it went from Iberian straight to Latin without ever passing through Celtic.
One clarification on the labels, because it was raised by a reader and it matters. The orange bars mark regions where Celtic was never spoken, meaning the Iron Age population of that territory spoke Iberian or Basque and the territory passed to Latin without a Celtic phase. That is a statement about the linguistic history of the ground, not about the ancestry of the people living on it today. Modern Catalans, as the section on what happened after the Iron Age shows, descend very largely from people who arrived after the Iron Age from north of the Pyrenees, and the Hallstatt affinity they carry came with them.
The Basques are the sharpest case in the whole dataset. Eleven Basque population averages fall inside the cut, running from Araba at 0.0336 to Soule at 0.0451. Every single one is closer to the Hallstatt core than the Scots at 0.0462, and every single one is very much closer than the Irish at 0.0501. A population that has never spoken an Indo European language of any description, let alone a Celtic one, is genetically nearer to the Iron Age Celtic heartland than the two populations that still speak Goidelic today.
The Celtic speakers themselves finish 28th, 46th, 49th, 74th and 89th out of 89.
Read that ordering slowly, because it inverts the received picture completely. The populations that abandoned Celtic two thousand years ago are the ones that look like Hallstatt. The populations that never spoke it at all look more like Hallstatt than the populations that still do. If genetic proximity to the Iron Age heartland were what carried or kept the language, the map would be upside down.
What the ranking actually tracks is the ratio of early farmer to steppe ancestry, which in western Europe runs on a gradient from the Mediterranean to the North Sea and the Atlantic. Hallstatt sits at a particular point on that gradient, and whichever modern population happens to share that point ranks close, whatever its linguistic history. Occitans, Catalans and Basques are near neighbours on that axis for reasons that predate Celtic by three thousand years.
Two things could produce the pattern in the Celtic bands specifically. Either the language did not travel with people at all, or it travelled with people and something happened afterwards that scrambled the correspondence. The rest of this article separates those two possibilities, and the answer turns out to be both, in different places.
A correction, and thanks for it
An earlier version of this chart showed fifteen hand picked populations rather than the full ranking, and the only two Iberian entries in it were the Galicians and the Asturians, who happen to be the two most Hallstatt distant Iberian groups of roughly thirty available. Adam pointed out that this omitted the northeastern Iberians entirely, and that Barcelona and central Catalonia sit ahead of both the Germans and the Austrians. He was right. The chart has been rebuilt to include those populations, with the rank of every bar in the full list of 89 shown beside it so that nothing is hidden by the selection, and the argument is stronger for it. The Basque and Catalan cases make the point about what this distance measures far better than the original fifteen did. The same rebuild also retired a claim about the English that did not survive a change of source file, which is discussed in the note on sample choice below.
Data and method
Everything below uses Global25 scaled coordinates, merged in the standard priority order from Davidski's published files, the Moriopoulos 2026 collection and the dated ancient sample file, giving 48,292 entries once individual level genotypes are included. Ancestry proportions come from non negative least squares with a sum to one constraint imposed by appending a heavily weighted row of ones, the resulting weights normalised. Distances are scaled Euclidean distances multiplied by one thousand, the convention used throughout this site.
The load bearing construction is an axis. Take the vector running from the English Chalcolithic to Early Bronze Age average, which is the population Britain had before any of this started, to the Knoviz group of the Bohemian Urnfield, which is the population that recent work identifies as the demographic vector. Score every population and every individual by where it falls along that line, with Britain at zero and Bohemia at one hundred. The two poles sit 52.8 units apart, which is comfortably above the twenty unit separation that made the equivalent analysis in our article on the Arras Culture unusable in absolute terms. This throws away twenty four of the twenty five dimensions, which is a real loss, but it buys numerical stability and it is exactly aligned with the question being asked.
A note on sample choice
Distances between closely spaced modern populations are not stable across source files, and the ordering of the Celtic speakers against their neighbours is a case in point. Davidski's unmixed averages put the Welsh at 0.0393 and the English at 0.0415, so the Welsh are closer to Hallstatt. The Moriopoulos averages put the English at 0.0390 and the Welsh at 0.0396, so the English are closer. The same applies to the Bretons, where a general Brittany sample sits at 0.0341 and a Finistere sample at 0.0393. Gaps of that size, under 0.003, carry no information and no claim in this article rests on one. What is stable across both files is the position of the Scots and the Irish at the far end of the ranking, and that is the only part of the ordering used below.
Three honest notes before any number is used. Several key averages rest on very few individuals, two for the Welsh Late Iron Age and seven for the Scottish, and every claim resting on them is flagged where it appears. There is no Irish Iron Age genome in Global25 at all, which is a hole in the middle of the most interesting case and is dealt with in its own section. And a Global25 coordinate is an autosomal summary with no dates attached and no way to distinguish maternal from paternal contribution, so nothing below speaks to sex bias or to admixture timing.
The wave did happen, and it is not Hallstatt
Start with Britain, because Britain has by far the best sampled Bronze Age to Iron Age transect in the Celtic speaking world.
The English transect on the axis from the local Bronze Age to the Bohemian Urnfield. The rise is concentrated between about 1100 and 800 BC, four centuries before Hallstatt begins.
The English Chalcolithic to Early Bronze Age population defines zero. By the Middle Bronze Age it has moved to 15.6, by the Late Bronze Age to 27.6, and by the Iron Age it is sitting between 40 and 56 depending on which subset is used. At the individual level the contrast is overwhelming: 63 Bronze Age genomes average minus 0.9 on this axis, 302 Middle Iron Age genomes average 47.7, and a Welch test returns a p value of 1.6 times ten to the minus twenty seven.
So continental ancestry did arrive in Britain, in quantity, and it arrived before the Iron Age. This reproduces with a different method what Patterson and colleagues established in 2022 on a far larger SNP panel: between roughly 1000 and 875 BC, ancestry from early European farmers increased sharply in southern Britain through the incorporation of migrants genetically closest to ancient individuals from France, contributing around half the ancestry of Iron Age England and Wales, and not reaching northern Britain. Their conclusion was that this is the most plausible vector by which early Celtic languages reached the island, and nothing in the Global25 transect contradicts it.
The chronology matters enormously. Hallstatt begins around 800 BC. The British shift is essentially complete by then. Whatever brought Celtic to Britain, it was not the Hallstatt culture, because the people had already arrived before Hallstatt existed. This is the first half of the resolution: the paradox partly dissolves once you notice that the answer to "where did Celtic come from" and the answer to "what does Hallstatt look like genetically" are questions about different centuries.
The dose falls off with distance
Now run the same two source model region by region, holding the continental source fixed and using each region's own Bronze Age population as the local baseline.
Share of a fixed Urnfield source in each Iron Age population, modelled against the local Bronze Age. Distances are approximate straight line distances from Bohemia.
Bohemia itself sits at 86.6 per cent, which is what you expect when a population is modelled against a source drawn from the same region. Austria returns 100 per cent, meaning the model refuses the local Unetice baseline entirely. France returns 90.1 in the Grand Est and 58.3 in the Hauts de France. Britain comes in between 40 and 51 across every subset tested: the Durotriges of Dorset at 51.1, mid to late Iron Age England at 49.1, Wales at 47.9, the Middle Iron Age at 45.8, and the Arras Culture of East Yorkshire at 40.4.
Then Scotland, at 10.9 per cent.
That is a clean west to east gradient with one very sharp edge at the northern end of Britain, and it survives substitution. Replacing the Bohemian source with the Hallstatt core average, with Hallstatt Bourgogne, or with the Neckarsulm Urnfield cemetery in Germany changes every absolute number, sometimes by a factor of two, but never changes the ordering and never lifts Scotland above about nine per cent.
All 488 individually genotyped genomes on the same axis. The English Iron Age cloud sits at the continental end, the Scottish Iron Age cloud sits on top of the British Bronze Age.
The individual level view sharpens the point into the single most awkward result in the article. Scotland's mid to late Iron Age population averages 13.9 on the axis. Scotland's own Chalcolithic to Early Bronze Age population averages 20.8. A Welch test between them returns a p value of 0.26. Within the resolution of this method, the people of Iron Age Scotland are the people of Bronze Age Scotland, unchanged.
And they spoke Celtic. Not as a matter of inference but as a matter of record: Ptolemy names Caledonian tribes, the place names of eastern Scotland are Brittonic, and Pictish is now generally accepted as a Brittonic language rather than a pre Indo European relic. A language arrived in a population that received, as far as the autosomes can say, essentially no incoming people at all.
Why that is not a contradiction
Language shift without population replacement is the normal case in history, not the exception. Latin replaced Gaulish across the whole of France with a Roman settler population in the low single digits. English replaced Irish across most of Ireland in the nineteenth century with essentially no Anglo-Saxon ancestry involved in the west at all. Nahuatl spread across central Mexico as an administrative language under the Triple Alliance. What the Scottish result establishes is not that something strange happened, but that the demographic threshold for language spread can be close to zero, which is exactly what makes the modern distance chart at the top of this article uninterpretable as evidence about language.
What this method cannot tell you
Here is the limit, stated before anyone else states it, because the result above is easy to over read.
Model England's Middle Iron Age as the English Bronze Age plus exactly one continental source, and try eleven different candidates for that source.
Eleven candidate continental sources, each run as the second source in the identical model. The bar is the residual; the figure on the right is the share the model assigns.
With no continental source at all the residual is 26.9. Adding a source, any source, cuts it to somewhere between 8.9 and 19.1. But the share assigned runs from 23.0 per cent for the Aragonese Urnfield to 76.4 per cent for the Kuckenburg cemetery in Saxony-Anhalt, and the residual ordering does not separate the candidates in any way that would let you pick between them. Bohemian Knoviz, the Hallstatt core, Hallstatt Bourgogne and the Neckarsulm Urnfield all land within two units of each other.
What Global25 can see, then, is that a continental population carrying more early farmer ancestry than Bronze Age Britain arrived in Britain during the Late Bronze Age. What it cannot see is which continental population that was. The specific identification of the Knoviz group of the Bohemian Urnfield as the source, and the linkage of that group to the formation of Celtic and Italic, rests on identity by descent segment sharing and on formal admixture graphs in the recent literature. Those are methods that use information a twenty five dimensional coordinate summary has destroyed. Everything in this article is therefore consistent with that identification and provides no independent support for it, and readers should treat the word Knoviz throughout as shorthand for "a Late Bronze Age central European source that this method cannot distinguish from several others".
Ireland, where the data runs out
Ireland is the hardest and most interesting case, and it is also the one where the honest answer is that we do not have the samples.
There is no Irish Iron Age genome in Global25. The transect runs from two Early Bronze Age individuals, sitting at 1.5 on the axis and therefore indistinguishable from Bronze Age Britain, straight to a medieval cemetery. That cemetery is Kilteasheen on the shore of Lough Key in County Roscommon, which supplies 63 individually genotyped genomes dating to around AD 1000. The gap between them is roughly two thousand years, and it contains the arrival of Goidelic Celtic, the entire Irish Iron Age, the Roman period, and the first two centuries of Norse settlement.
Kilteasheen averages 28.1 on the axis, comfortably below the English Iron Age at 47.7 and comfortably above Iron Age Scotland at 13.9, and both differences are highly significant. Modelled as Irish Early Bronze Age plus an Urnfield source, it returns 30.1 per cent, with a bootstrap interval over the 63 individuals of 26.3 to 33.9.
That number must not be read as a measurement of the Celtic arrival, and the reason is chronological rather than statistical. Anything that entered Ireland between 2000 BC and AD 1000 is inside it, and we know from the Kilteasheen publication itself that Anglo-Saxon-like and Norse ancestry is present in that cemetery. The 30 per cent is an upper bound on everything, not an estimate of one thing.
Detection floor
Injecting known quantities of Urnfield ancestry into the observed Kilteasheen genomes and rerunning the identical model recovers a one per cent injection as an increment of 0.7 points and a five per cent injection as an increment of 3.6 points, against a bootstrap interval on the null roughly 3.7 points wide. The detection floor for this configuration is therefore around five per cent. If Goidelic Celtic arrived in Ireland with a demographic contribution smaller than that, which the Scottish result shows is entirely possible, no amount of Global25 modelling will ever recover it. Resolving Ireland requires Iron Age Irish genomes, and they do not currently exist in this dataset.
The second half: what happened afterwards
Everything so far explains why Celtic speaking regions have low continental ancestry. It does not yet explain why the modern distance ranking looks the way it does. For that, look at what happened to each region after the Iron Age.
How far each modern population has moved from an Iron Age population of the same region. Orange marks regions where a Celtic language survived. The reference sample and its size are given beside each bar. Ireland has no Iron Age genome and uses a medieval baseline, so its bar is not comparable to the others.
Hungary has moved 76.7 units from its Early Iron Age population, Croatia 71.8, Slovenia 58.2, Austria 46.2, Bohemia 41.9, Germany 40.4. These are the regions closest to the Celtic heartland, and every one of them was demographically remade afterwards, by Roman provincial settlement, by the Germanic migrations, by the Slavic expansion, by the Magyar conquest. Celtic died in all of them. Spain and Portugal, at 46.4 and 47.9, tell the same story: Celtiberian and Lusitanian were spoken there, the populations were remade under Rome and after, and the languages went.
Below about 40 units the pattern stops being predictive. England moved only 10.6 and lost Celtic completely to a North Sea source close enough to the existing population that the coordinate shift is small. France moved 20.7 and lost it to Latin. The Netherlands moved 25.3 and lost it to Germanic. Wales moved 38.6 and kept it. Scotland moved 20.6 and kept it. Ireland, on a medieval rather than Iron Age baseline, moved 12.9 and kept it.
So the relationship is one sided. A large post Iron Age shift is sufficient for Celtic to disappear, and no region above 40 units retained it. A small shift is not sufficient for it to survive, and England is the proof. What the ranking at the top of the article captures, then, is mostly the first of those: the regions nearest Hallstatt are the ones that look most like it today because they received the most from the populations that replaced its people, and those same populations are the ones that replaced its language.
Catalonia, the clearest case of all
A reader pointed out that modern Catalans carry more Hallstatt like ancestry than Galicians or Asturians do, and on a three source model that is correct: Barcelones and central Catalonia return 76 to 80 per cent Hallstatt like against 71 to 74 for the northwest, with the larger difference being a North African share of 5 to 7 per cent in Catalonia against 12 to 13 in the west. But the Iron Age population of Catalonia is in the file. The Ilergetae, Iberian speakers, sit 68.8 units from the Hallstatt core, against 27.0 for the Iron Age population of Occitanie. Modelled as Ilergetae plus Iron Age Occitanie plus a Moroccan pole, every modern Catalan population returns zero for the Ilergetae and 93 to 94 per cent for Occitanie, and the Ausetani of the Roman Republic already return 70 per cent. Two caveats apply: the Ilergetae are two low resolution genomes, so a strict zero may be the model rejecting a noisy pole, and the same model gives Galicia 87 per cent Occitanie too, so what it is seeing is a turnover across Iberia rather than a Catalonia specific stream. The direction is not in doubt. The Hallstatt affinity of modern Catalonia arrived after the Iron Age, with people who had stopped speaking Celtic before they crossed the Pyrenees. It is the second half of this argument in a single region.
What this chart cannot do
Several reference samples are thin: three individuals for Austria, seven for Scotland and Bohemia, eight for France. Wales moves from 22.8 to 38.6 depending on whether a Late Iron Age subset of two individuals or the full Iron Age set is used, and the larger figure is reported. Brittany and Cornwall are omitted because neither has an Iron Age sample of its own; an earlier draft used an English reference for both, which produced a Breton figure of 9.7 that measured nothing about Brittany. Ireland is on a medieval baseline because there is no Irish Iron Age genome, and its bar should not be read alongside the others.
What about the Atlantic hypothesis
The Atlantic Bronze Age model deserves a direct test rather than a dismissal, because it is the one hypothesis on which the western populations should look ancestral rather than peripheral.
It does not survive the transect. If Celtic formed in the Atlantic network and spread inland, the Bronze Age populations of Britain and Ireland should look like the source and the continental Iron Age populations should look derived from them. What the data shows is the reverse: Bronze Age Britain sits at zero on the axis, Iron Age Britain sits at 46, and the movement is from the continent outward. Modelling England's Middle Iron Age as pure descent from the English Bell Beaker population, with no continental input at all, leaves a residual of 36.6, which the addition of a single continental source cuts to under 12.
There is one component of the Atlantic case that the genetics does not touch, and it should be conceded. The Tartessian inscriptions are a philological argument, and whether they are Celtic is a question for epigraphers rather than for coordinate calculators. But the demographic claim, that people moved from the Atlantic facade into central Europe during the Bronze Age in sufficient numbers to carry a language family, finds no support here at all.
Myth and measurement
| The received story | What the genomes record |
|---|---|
| Celtic spread with the Hallstatt culture from the eastern Alps after 800 BC. | The continental ancestry shift into Britain is essentially complete by 800 BC. The relevant expansion is Late Bronze Age and pre Hallstatt. |
| Celtic formed on the Atlantic facade and spread inland. | The movement runs the other way. Bronze Age Britain sits at zero on the continental axis and Iron Age Britain at 46. Pure Beaker descent leaves a residual three times too large. |
| The regions that still speak Celtic should be the ones most closely related to the Celtic heartland. | They finish 28th, 46th, 49th, 74th and 89th of 89. Every Basque population, never Indo European speaking, ranks ahead of the Scots and the Irish. |
| A language family spreading across a continent requires substantial population movement everywhere it goes. | Iron Age Scotland is statistically indistinguishable from Bronze Age Scotland at p equal to 0.26, and spoke Brittonic. The demographic threshold can be near zero. |
| Global25 can identify the specific source population of the Celtic expansion. | Eleven continental candidates fit the same target with residuals between 8.9 and 19.1 and shares between 23 and 76 per cent. The identification belongs to haplotype methods, not to this one. |
The through line is short enough to state in a sentence. Celtic spread west out of Late Bronze Age central Europe with a wave of people whose demographic weight thinned steadily as it travelled, reaching about half the gene pool in southern Britain, a third in the Irish sequence at the outside, and effectively nothing in Scotland; and it then survived only in places where the thinning had been severe, because every region that was demographically remade after the Iron Age lost the language, and the regions that were remade were the ones nearest the source.
The Irish, who are the furthest population in Europe from Hallstatt, and the Scots, whose Iron Age ancestors received no measurable continental ancestry at all, are not anomalies in the story of the Celtic languages. They are the reason the Celtic languages still exist.
The coordinates
Every population referenced above, in Global25 scaled format, for anyone who wants to reproduce the models in Vahaduo (the Global25 tool). Coordinates are merged first occurrence wins from the Davidski Global25 files, the Moriopoulos 2026 collection and the dated ancient sample file. The final entry is the four site Hallstatt core average used in the first chart.
Austria_IA_Hallstatt_Gmunden_(n=5),0.134084,0.145221,0.054758,0.01292,0.0484398,0.000558,0.000423,0.0004614,0.0120668,0.0219414,0.0018188,0.0048856,-0.0159958,-0.0030828,0.001276,0.0002388,0.0058934,0.0025846,0.0056064,0.0006252,-0.0001996,0.0058612,-0.0043384,-0.0043618,7.18e-05
Germany_EIA_Hallstatt_D_Magdalenenberg_(n=9),0.126597,0.142626,0.0545147,0.0214974,0.0457862,0.00387356,0.000130556,0.00641,0.0149982,0.0232048,-0.00258011,0.007843,-0.0139247,-0.0105052,0.00487078,0.00972322,0.00460689,0.002041,0.00481844,0.00362667,0.00246778,0.00570167,4.11111e-05,-0.000843444,-0.00397833
Germany_EIA_Hallstatt_D_Heuneburg_(n=2),0.130896,0.143698,0.060528,0.0176035,0.051702,0.0012555,0.00329,0.0053075,0.0142145,0.022233,-0.0097435,0.0005245,-0.0161295,-0.010184,0.0023755,-0.004906,-0.0052805,0.0044975,0.001383,-0.0043145,0.0018095,0.007048,0.005854,0.004639,0.001856
Czechia_EIA_Hallstatt_Bylany_(n=7),0.127645,0.141594,0.0581843,0.0305004,0.042821,0.0110361,0.00329014,0.006659,0.0071,0.0118454,-0.00575329,0.00357543,-0.0108946,-0.00489529,0.0100431,0.00196986,-0.00612814,0.00137557,0.00508171,0.003448,0.005419,0.00381571,-0.001391,-0.00340814,0.000667143
Czechia_LBA_Urnfield_Knoviz_(n=35),0.129498,0.140288,0.0568051,0.0323646,0.0446676,0.0100003,0.00216209,0.00603931,0.0131245,0.0147872,-0.00122026,0.00533523,-0.0118759,-0.00767934,0.0062354,0.00606889,0.00233943,0.0005394,0.00340106,0.00188309,0.00382183,0.00235294,-0.00267271,-0.00425183,0.000229314
Germany_LBA_Urnfield_Neckarsulm_(n=7),0.122604,0.144931,0.048379,0.0119049,0.0481407,7.95714e-05,-0.00127571,0.00234043,0.0182319,0.032542,-0.00412943,0.0114967,-0.0183913,-0.0145291,0.00484714,0.00337143,0.00793486,0.00157443,0.00601557,-0.00225114,0.00146157,0.00665957,-0.00309857,-0.000120429,-0.00369514
Spain_Aragon_LBA_Urnfield_(n=14),0.115693,0.148267,0.0566219,0.00422207,0.0643196,-0.00458179,-0.00522036,0.00357686,0.0353534,0.050948,-0.00347964,0.0118181,-0.0243803,-0.014991,0.00766807,0.00250979,0.00137836,-0.000542929,0.00252307,-0.00412679,0.0087435,0.00488443,-0.00800221,-0.0139606,0.00171914
France_IA1_Hallstatt_Bourgogne-Franche-Comte_(n=27),0.126681,0.145146,0.0524337,0.0212941,0.0462878,0.00667267,0.00139256,0.00439296,0.0173543,0.023387,-0.00217719,0.00754878,-0.0150036,-0.0115959,0.00745452,0.00197907,-0.00303748,0.000403519,0.00335196,-0.0010237,0.00376648,0.00414926,-0.00519926,-0.00178963,0.000217222
France_IA1_Hallstatt_D-Early_La_Tene_Hauts-de-France_(n=16),0.127268,0.139572,0.0584773,0.0370037,0.0430464,0.0117832,0.00133656,0.00712475,0.00922912,0.0105697,-0.00206038,0.00677219,-0.0132587,-0.0116721,0.0141404,-0.000149125,-0.00862981,7.9375e-06,0.00250613,0.00139906,0.0036185,0.0017465,-0.00375137,0.00167187,-0.00105538
France_IA2_La_Tene_Grand_Est_(Intermediate_Profile)_(n=8),0.125632,0.138874,0.0566151,0.0299986,0.0486243,0.00881975,0.00376013,0.0001155,0.0140354,0.0187476,-0.002314,0.00828025,-0.015089,-0.007535,0.00914412,-0.000232,-0.005688,0.00155188,0.0021055,-0.00397075,0.00421125,0.00153038,-0.00301963,-0.00195812,-0.00179625
Austria_IA_La_Tene_Pottenbrunn_(n=3),0.129379,0.147929,0.046386,0.004845,0.043085,0.00353267,0.00250667,0.00599967,0.015271,0.0221717,-0.00113667,0.00654433,-0.0104557,-0.00311933,0.001493,-0.00477333,-0.00343333,0.005701,0.00796067,-0.001959,0.00178833,-4.13333e-05,-0.003533,-0.00116467,-0.00443067
France_EBA_Grand_Est_(n=8),0.129901,0.133415,0.0601978,0.0379929,0.042431,0.0160015,-0.00193875,0.00126938,0.0125269,0.0138499,-0.00383625,0.00588237,-0.0137696,-0.0134698,0.0175419,0.00551912,4.9e-05,0.00394312,0.003881,0.00706588,0.0125871,0.00292125,-0.00349712,-0.00326838,-0.00541862
Czechia_Bell_Beaker_Late_(n=49),0.126599,0.131086,0.0543131,0.0460769,0.0318866,0.0153333,0.00312698,0.00407365,0.00157353,0.00253269,-0.000324776,0.00456033,-0.0128698,-0.013414,0.0140789,0.00921361,0.000494898,0.00104194,0.00275765,0.00369318,0.00416865,0.00432535,-0.000895429,0.00102792,-0.00154449
Austria_EBA_Unetice_Unterhautzenthal_(n=25),0.128074,0.130231,0.0556026,0.049251,0.0315503,0.0167223,0.0033934,0.00576908,-0.00012264,-0.00325104,-0.00215656,0.00386656,-0.00855684,-0.00783892,0.0154178,0.0047572,-0.00622716,0.00205232,0.00283568,0.00102048,0.00256548,0.00388768,-0.000557,0.00216408,-0.00012936
England_CA-EBA_(n=32),0.125277,0.126338,0.0618242,0.0619252,0.0298996,0.0210476,0.00569884,0.00359125,-0.000549594,-0.00659469,-0.00330347,0.00540922,-0.0113866,-0.0165619,0.0259438,0.00938488,-0.00493019,0.00227641,0.00114691,0.00670237,0.00494047,0.00250019,-0.000234906,0.00544881,-0.000535156
England_MBA_(n=28),0.126588,0.129408,0.0635179,0.059582,0.034512,0.019841,0.001645,0.00392282,0.00475525,-0.00206307,-0.00492389,0.00477968,-0.0112239,-0.01476,0.0235572,0.00734918,-0.00847961,0.00206775,0.000493821,0.00355518,0.00510707,0.00383764,-0.000457821,0.00513839,-0.000718429
England_LBA_(n=12),0.127672,0.131596,0.0612507,0.0531873,0.0358783,0.0175237,0.00307467,0.0051535,0.00242025,0.00104792,-0.00542642,0.00576975,-0.0177278,-0.0156316,0.0234117,0.00566817,-0.0043245,0.00267092,0.000324667,0.00351217,0.00617658,0.00320467,-0.000944917,0.0061755,-0.0021355
England_EIA_(n=32),0.127162,0.136113,0.0613293,0.0450181,0.0402478,0.0153216,0.00257766,0.00459356,0.00874981,0.0100116,-0.00416116,0.00592913,-0.0169008,-0.0128935,0.0203835,0.00280509,-0.00829166,0.00182503,0.00117847,0.00123103,0.00650806,0.00352422,-0.00273831,0.00233469,0.00151184
England_MIA_(n=86),0.129639,0.135219,0.0602867,0.0474359,0.0397604,0.0166653,0.00173791,0.00471445,0.00724399,0.0057489,-0.00517943,0.00670571,-0.015236,-0.0156442,0.0216584,0.0061685,-0.00529117,0.00185174,0.00146014,0.00340136,0.00596767,0.00419848,-0.00178713,0.0057544,-0.00140491
England_MIA-LIA_(n=64),0.130025,0.136176,0.0609993,0.0466281,0.0404305,0.0156353,0.00294486,0.0044998,0.00743952,0.00679683,-0.0037095,0.0060462,-0.0140508,-0.0136741,0.0212954,0.00612392,-0.00793716,0.00157569,0.00175187,0.00355255,0.00562673,0.00377536,-0.00298875,0.00543555,-0.000974828
England_LIA_(n=23),0.128026,0.133079,0.0603721,0.0484219,0.0377193,0.0173034,0.003382,0.00573891,0.00457952,0.00427865,-0.0044057,0.00587087,-0.0140646,-0.0152822,0.0208596,0.0085953,-0.000436391,0.00124487,0.00203848,0.00555143,0.00384104,0.00235478,-0.00163443,0.0076593,-0.00174413
England_LIA_Durotrigian_(n=9),0.13115,0.135065,0.059627,0.0451123,0.0401099,0.0167336,0.00282,0.00687133,0.00772633,0.00897011,-0.00700078,0.00661089,-0.0160223,-0.0196494,0.0210216,0.0170747,0.00549044,0.000239222,-0.000111778,0.00629478,0.00747289,0.00164878,-0.000438111,0.00656033,-0.000558889
England_MIA-LIA_East_Yorkshire_(n=34),0.129758,0.132168,0.0600398,0.0489345,0.0390478,0.0171846,0.00217032,0.00418079,0.00526335,0.00569224,-0.00505797,0.00637371,-0.0150629,-0.0178263,0.0219069,0.00888744,-0.002669,0.00144197,0.000879794,0.00289103,0.00536553,0.00387694,-0.00291447,0.00681165,-0.000137353
Wales_LIA_(n=2),0.131466,0.132526,0.0629795,0.046512,0.0400075,0.0139445,0.0019975,0.004615,0.0043975,0.0011845,-0.006658,0.013563,-0.007879,-0.0123865,0.013301,0.014121,0.0024775,0.003484,-0.0005655,0.0031265,0.00574,0.0043275,0.00228,0.007772,-0.0035925
Scotland_CA-EBA_(n=7),0.123579,0.126651,0.0617941,0.0598934,0.0296759,0.0173707,0.000100571,0.00161543,0.00260043,-0.003046,-0.000742429,0.00117729,-0.0123177,-0.0169864,0.0225099,0.0145659,0.00262643,0.00430757,0.000592429,0.00269771,0.010713,0.002049,-0.00596857,0.00108429,-0.00685986
Scotland_MIA-LIA_(n=7),0.13171,0.129407,0.0614709,0.0602626,0.0323137,0.0178491,0.00527114,0.00708757,0.000555,-0.00255129,-0.00573,0.00783586,-0.0138043,-0.0147453,0.0262329,0.00765229,-0.00564343,0.00195471,-0.00231643,0.00505614,0.00495571,-0.00123671,-0.00128543,0.008297,0.000804143
Ireland_EBA_(n=2),0.126343,0.129988,0.0607165,0.0644385,0.0296975,0.022172,0.0019975,0.006,0.002761,-0.0058315,-0.00138,0.0086925,-0.009737,-0.0165835,0.0229365,0.0146515,-0.003716,0.006968,0.0011315,0.0049395,0.006613,0.00643,0.00228,0.0110255,-0.0029335
Ireland_Early-High_Medieval_Kilteasheen_(n=29),0.124734,0.130933,0.0600923,0.0519696,0.0378214,0.0188492,0.000818483,0.00533134,0.00388586,0.00113741,-0.00572286,0.00724014,-0.0158606,-0.0179098,0.0255529,0.00809252,-0.00797134,0.00199214,0.00233193,0.00351024,0.00434159,0.00406769,0.00175952,0.0117464,-0.000128
Irish_(n=106),0.133453,0.134413,0.0616935,0.0491697,0.0376636,0.0193607,0.00314988,0.00466413,0.00365028,0.00266225,-0.00674275,0.00580583,-0.0141729,-0.0138804,0.025808,0.00529827,-0.0106913,0.00189756,0.000913734,0.00180714,0.00493851,0.00150753,0.000662714,0.0145304,0.000808434
Scottish_(n=41),0.131535,0.134223,0.0622801,0.0475361,0.0385661,0.0173592,0.0035938,0.00519493,0.00406056,0.00315576,-0.0057509,0.00523437,-0.0124078,-0.0133259,0.0233836,0.00480237,-0.00973107,0.00284283,0.00241898,0.00225112,0.00380117,0.00336576,-0.00069139,0.0150682,-0.00111568
Welsh_(n=22),0.131631,0.138657,0.0601971,0.0432844,0.0407775,0.0166054,0.00315917,0.00612506,0.00611536,0.00409949,-0.00435344,0.00574232,-0.0129775,-0.0102771,0.0207536,0.00492861,-0.00959964,0.0027412,0.00313507,0.00193205,0.00496805,0.00398735,0.000280397,0.011509,0.00110658
Cornish_(n=15),0.130365,0.138924,0.0607667,0.0435189,0.0413615,0.0158409,0.00335267,0.0063074,0.00662667,0.00711927,-0.00526127,0.0057948,-0.0136867,-0.0111841,0.0209915,0.0035358,-0.0115347,0.00171447,0.0036788,0.0030848,0.00534887,0.00367653,-0.0005094,0.0133672,0.000495067
Breton_Finistere_(n=17),0.131968,0.136499,0.0611156,0.042883,0.0389575,0.0159952,0.00517,0.00525324,0.004704,0.00657129,-0.00693494,0.00521888,-0.0159066,-0.0131875,0.0212683,0.00463288,-0.00648076,0.000782412,0.000850235,0.003737,0.00314147,0.00288765,-0.000434941,0.0101006,0.00113412
English_(n=44),0.131362,0.137466,0.0599194,0.0427021,0.0400354,0.0162898,0.00402705,0.00649275,0.00519675,0.00527241,-0.0059825,0.00538155,-0.0133963,-0.010697,0.0197905,0.00709657,-0.00565693,0.00241277,0.00287398,0.00367211,0.00572852,0.00256852,-0.00185989,0.0125153,0.000255932
French_(n=64),0.127251,0.142063,0.0480358,0.0198039,0.0404546,0.00572597,0.00287516,0.00344335,0.0109644,0.0179218,-0.00353196,0.00696649,-0.0140298,-0.00921854,0.01125,0.00357577,-0.00152588,-0.000237546,0.00112343,0.000848025,0.00278214,0.0018239,-0.00130374,0.00593639,-0.00134902
Belgian_(n=311),0.128346,0.140342,0.0518886,0.0278777,0.0394908,0.0104409,0.00316534,0.00476364,0.0074089,0.0105334,-0.00430825,0.00556486,-0.0116992,-0.00832861,0.0131387,0.00300177,-0.00484433,0.00141392,0.00220276,0.000787736,0.0033245,0.00254703,-0.00044464,0.00885942,-0.000182113
Dutch_(n=167),0.127471,0.134196,0.0602746,0.0440856,0.0408397,0.0164084,0.00539707,0.00725349,0.00420403,0.00192504,-0.00563956,0.00443534,-0.00985728,-0.00867688,0.017847,0.00563415,-0.0065178,0.00175288,0.00390904,0.002818,0.00447835,0.00337824,6.24e-07,0.0139005,-0.000654138
German_(n=113),0.130332,0.137375,0.0581767,0.0389144,0.0394845,0.0157586,0.00437152,0.00616515,0.00373205,0.000935354,-0.00414453,0.00225598,-0.00509524,-0.00149317,0.00879654,0.00271283,-0.00369461,0.00161226,0.00376211,0.00136014,0.00300019,0.00174972,0.000325062,0.00843375,0.000260717
Austrian_(n=18),0.129126,0.135122,0.0542843,0.0331075,0.0349466,0.0127516,0.00712856,0.00620489,0.003193,0.00229828,-0.00355439,0.000607889,-0.00162694,0.00284422,0.000467444,0.00473633,0.00132544,0.000922056,0.00318422,0.00122267,-0.000623889,-0.00207456,0.0019035,0.003501,-0.00114417
Swiss_German_(n=9),0.127229,0.141046,0.0450031,0.0222152,0.04011,0.00737511,0.00289833,0.00520489,0.00938511,0.0119262,-0.00138933,0.00461256,-0.0146347,-0.008915,0.00892733,-0.000662778,-0.00357822,0.000703667,0.00532111,-0.00120889,0.00202422,0.00329733,-0.00320444,0.00755133,-0.00262111
Czech_(n=175),0.131638,0.13282,0.0609923,0.0462776,0.0381081,0.0173693,0.00698698,0.00840095,0.00168877,-0.0083037,-0.00278655,-0.00239442,0.00453286,0.0110829,-0.00254767,0.000909171,0.00121965,0.000190326,0.00333642,0.00135853,-0.00159718,-0.00127115,0.00445873,0.00157746,-0.000140309
Hallstatt_core_4sites,0.129805,0.143284,0.056996,0.020630,0.047187,0.004181,0.001783,0.004709,0.012095,0.019806,-0.004065,0.004207,-0.014236,-0.007167,0.004641,0.001756,-0.000227,0.002625,0.004222,0.000846,0.002374,0.005607,0.000041,-0.000994,-0.000346
Acknowledgements
Thanks to Adam for the critique of the original distance chart, which caught a genuine sampling problem in the Iberian coverage, for the point about the Catalan case, and for pressing on the labels. All three led to changes above. Corrections of this kind make the site better and are always welcome.
References
- BRITAIN Patterson, N. et al. 2022. Large-scale migration into Britain during the Middle to Late Bronze Age. Nature 601, 588 to 594.
- BRITAIN Cassidy, L. M. et al. 2025. Continental influx and pervasive matrilocality in Iron Age Britain. Nature 637, 1136 to 1142.
- CENTRAL EUROPE McColl, H. et al. 2024. Steppe Ancestry in western Eurasia and the spread of the Germanic Languages. bioRxiv 2024.03.13.584607.
- CENTRAL EUROPE Papac, L. et al. 2021. Dynamic changes in genomic and social structures in third millennium BCE central Europe. Science Advances 7, eabi6941.
- FRANCE Fischer, C. E. et al. 2022. Origin and mobility of Iron Age Gaulish groups in present-day France revealed through archaeogenomics. iScience 25, 104094.
- FRANCE Brunel, S. et al. 2020. Ancient genomes from present-day France unveil 7,000 years of its demographic history. PNAS 117, 12791 to 12798.
- IBERIA Olalde, I. et al. 2019. The genomic history of the Iberian Peninsula over the past 8000 years. Science 363, 1230 to 1234.
- IRELAND Cassidy, L. M. et al. 2016. Neolithic and Bronze Age migration to Ireland and establishment of the insular Atlantic genome. PNAS 113, 368 to 373.
- IRELAND Cassidy, L. M. et al. 2020. A dynastic elite in monumental Neolithic society. Nature 582, 384 to 388.
- BRITAIN Olalde, I. et al. 2018. The Beaker phenomenon and the genomic transformation of northwest Europe. Nature 555, 190 to 196.
- BRITAIN Olalde, I., Armit, I. et al. 2026. Genomic insights into the Arras Culture of Iron Age Britain. Nature, in press.
- LINGUISTICS Koch, J. T. and Cunliffe, B. (eds) 2013. Celtic from the West 2: Rethinking the Bronze Age and the Arrival of Indo-European in Atlantic Europe. Oxbow Books.
- LINGUISTICS Sims-Williams, P. 2020. An Alternative to Celtic from the East and Celtic from the West. Cambridge Archaeological Journal 30, 511 to 529.
- DATA Global25 coordinates by Davidski, Eurogenes Blog. Population averages from the Moriopoulos 2026 collection.