
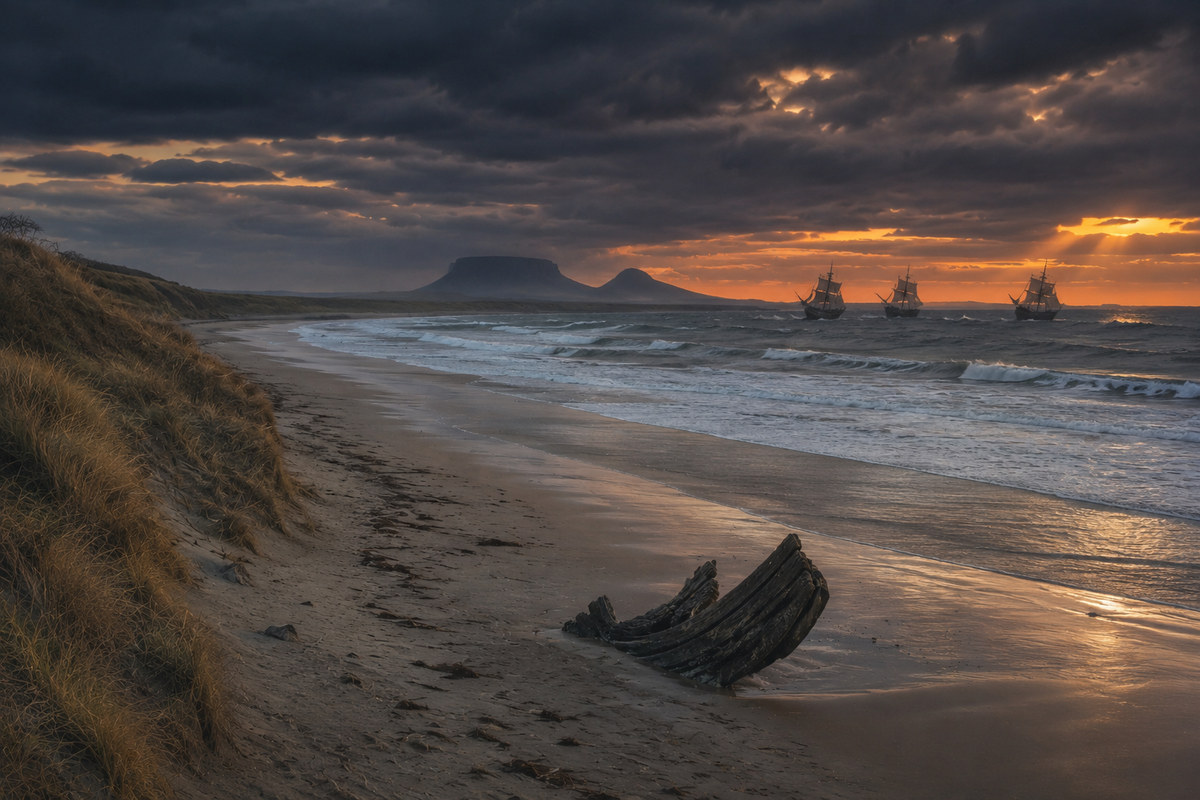
In September 1588 the wreckage of the Spanish Armada came ashore along the Atlantic coast of Ireland, twenty four ships from Antrim to Kerry, and out of that fortnight grew the most durable origin story in the country: that the dark hair and dark eyes found in the western counties are the legacy of Spanish sailors who survived the surf. This article tests the claim against a pre-Armada Irish baseline, twenty nine genomes from a medieval cemetery in Roscommon, and eighty five living Irish individuals. The Irish turn out to be the least Iberian shifted population in the whole archipelago, sitting eleven times closer to a Scot than to any Spaniard and roughly ten times less continental than the English on the one axis that measures it. The detection floor is three per cent. The most generous possible reading of the historical record puts the Armada contribution near five hundredths of one per cent. And the section explaining why that gap matters, rather than settling the question, is the most useful thing here.
A myth with a date on it
Most origin myths are undatable, which is what makes them comfortable. This one is not. The Armada myth names a year, a fleet, a coastline and a mechanism, and that is unusual enough to be worth taking seriously as a hypothesis rather than dismissing as folklore.
The facts of the wrecking are not in dispute. Philip the Second sent a hundred and thirty ships north in the summer of 1588. After the fighting in the Channel and the battle of Gravelines the fleet was driven up the North Sea and around the top of Scotland, and the return leg down the Atlantic went catastrophically wrong. Twenty four vessels were lost on the Irish coast. At Streedagh in County Sligo three ships went down in a single day. At Spanish Point in Clare the survivors who reached the beach were killed on the sand.
What happened afterwards is where the myth and the record part company. The English administration in Ireland, holding the island with a small army and terrified that shipwrecked Spanish soldiers would make common cause with the Gaelic lords, ordered that all Spaniards be put to death. Around sixteen hundred men were taken prisoner in Ireland and roughly eleven hundred of those were executed summarily. Some Irish lords, notably Brian O Rourke of Leitrim, sheltered survivors and paid for it; others, including the O Malleys of Clare Island, killed them for their gold. The men who did escape mostly did so by getting a boat to Scotland. Francisco de Cuellar, the one survivor who left a full account, spent seven months on the run and then left.
So the mechanism the myth requires, a substantial cohort of Spanish men settling permanently into the west of Ireland and fathering children there, is not what the documents describe. But documents are incomplete and people are discreet, and the honest way to test a demographic claim is demographically. That is what follows.
Data and method
Everything below uses Global25 scaled coordinates, merged first occurrence wins from Davidski's published files, the Moriopoulos 2026 collection and the dated ancient sample file, giving 30,076 entries. Ancestry proportions come from non negative least squares with a sum to one constraint imposed by appending a heavily weighted row of ones, the resulting weights normalised. Distances are scaled Euclidean distances multiplied by one thousand, the convention used throughout this site.
The Irish are represented three ways. There is the Moriopoulos population average of 106 individuals, there is Davidski's own Irish average, and there are eighty five separately genotyped Irish individuals, which is what makes the individual level tests below possible. Controls are twenty eight Scots, twenty Welsh and nineteen English, all individually genotyped, plus their population averages.
The load bearing choice is the baseline. Asking whether modern Irish people carry Spanish ancestry is meaningless without a statement of what they would look like if they did not, and the usual move is to use another modern population, which builds the answer into the question. Instead the baseline here is Kilteasheen, a cemetery on the shore of Lough Key in County Roscommon, twenty nine individuals dating to around the year 1000. These are Irish people who lived and died six centuries before the Armada sailed. If Spanish ancestry entered the Irish gene pool in 1588, modern Irish people must have moved away from Kilteasheen in the direction of Iberia. If they have not moved, or have moved in some other direction, the hypothesis is in trouble.
Three honest notes before any number is used. Kilteasheen is one cemetery in one province and is not a perfect ancestor of the modern Irish population, which is exactly why the zero point of every model below has to be calibrated rather than assumed. Global25 has no province level Irish samples, so the specific claim that the west differs from the east cannot be tested directly here and is addressed with published haplotype work instead. And a Global25 coordinate is an autosomal summary with no dates attached and no way to distinguish maternal from paternal contribution, so nothing below speaks to sex bias or to admixture timing.
Where the Irish actually sit
The simplest measurement first, and it is already awkward for the myth.
Every relevant population ranked by Global25 distance from the modern Irish average. The Iberian block does not overlap the British and near continental block at any point.
The Scots sit at 6.2 units. The medieval Irish of Roscommon sit at 10.8 and 12.9 depending on which average is used. The Welsh, Bretons, Cornish and English cluster between 12.4 and 13.5. Then nothing for fifty units, and the first Iberian population, the Catalans, appears at 70.4. Galicians, the northwestern Spaniards from whose ports much of the Armada actually sailed, sit at 77.9. Andalusians at 83.8.
That gap is not by itself an argument. Two populations can be far apart and one can still carry a few per cent of the other. What it does establish is the geometry the rest of the article works in: the Iberian pole is a long way from the British Isles cline, which is good news for a model, because a source that is far from the target in coordinate space is a source whose contribution a model can actually resolve.
The test that can fail
Take the vector running from the medieval Irish average to the modern Galician average, and score every population by where it falls along that line, with Kilteasheen at zero and Galicia at one hundred. This throws away twenty four of the twenty five dimensions, which is a real loss, but it buys numerical stability and it is exactly aligned with the question being asked. If the Armada left a five per cent mark, the modern Irish should sit near five.
Projection onto the medieval Irish to Galician axis. The population that is supposed to be part Spanish is the one closest to its own medieval ancestors.
The modern Irish score 1.2. The Scots score 4.3. The Welsh score 12.9, the Bretons 13.4, the English 13.4, the Cornish 14.0, and the French of Brittany 22.1.
Read that ordering carefully, because it inverts the received picture completely. On the one axis in this dataset that measures displacement towards Iberia, the Irish are the least Iberian shifted population in northwestern Europe. The English are more than eleven times further along it. If the folk theory were reversed and someone claimed that the English are the ones with Spanish ancestry, the numbers would support them better than they support the Irish version, and they still would not support it well, because the axis is picking up something else entirely, which the deep ancestry section below explains.
The two poles sit 77.8 units apart. That is comfortably above the twenty unit separation that made the equivalent analysis in our article on the Arras Culture of Yorkshire unusable in absolute terms, and comfortably below the several hundred unit separations of the deep panels used elsewhere on this site. It is enough to trust the direction and the ordering; the absolute percentages get their own robustness section.
Every individual, one dot each
Population averages hide people, and the myth is really a claim about individuals: that some Irish families, in particular coastal ones, carry a Spanish ancestor. Eighty five separately genotyped Irish individuals let us look.
All 152 individually genotyped genomes from Ireland, Scotland, England and Wales on the same axis. The Irish cloud sits furthest from the Iberian end.
The Irish mean is 1.66 with a standard deviation of 7.99 across eighty five people, giving a standard error of 0.87. The Scots come in at 5.27, the English at 10.93, the Welsh at 13.11. A Welch test puts the Irish significantly below the English at a p value of 1.2 times ten to the minus five and below the Welsh at 7.9 times ten to the minus seven. Even the Irish to Scottish contrast clears significance at 0.048.
There are Irish individuals at the high end. The most Iberian shifted person in the Irish sample scores 19.7. But the most Iberian shifted Scot scores 24.9 and the most Iberian shifted Welsh person scores 24.5, so the Irish tail is not merely unremarkable, it is shorter than everyone else's. Nothing in the Irish distribution looks like a subpopulation with foreign ancestors mixed in.
A useful embarrassment
Two medieval individuals from Donegal are in the dataset, from precisely the stretch of coast where the Armada myth is strongest. One of them, dated to about AD 832, scores 10.2 on this axis, six times the modern Irish average. He died seven hundred and fifty six years before the Armada sailed. This is what individual level noise looks like on a one dimensional projection, and it is the reason no claim in this article rests on any single person's score.
What we would have seen
A null result is worth nothing until you know what the instrument could detect, and this is the question most amateur analyses skip. So the next step is to build the effect artificially and check whether it shows up.
Take the eighty five Irish genomes, mathematically inject a known fraction of Galician ancestry into each, resample eighty five individuals with replacement, and ask how often the resulting mean clears the ninety fifth percentile of the purely observed null. Four thousand replicates per level.
Detection power and spike in recovery. The two source model returns injected ancestry essentially one to one down to half a per cent.
A half per cent injection comes back as a half per cent increment. A one per cent injection comes back as one. The estimator is linear with an offset of 1.17 points, which is simply the model's reading of the observed sample. In power terms, a two per cent Iberian component would have been caught three times in four and a three per cent component would have been caught in ninety seven runs out of a hundred.
The detection floor is therefore about three per cent. The observed value is 1.17, which the robustness section is about to show is not Iberian at all.
Is the 1.17 even Spanish?
Two things have to be checked before that number is quoted anywhere. The first is whether it survives changing the poles. The second is whether an Iberian source is doing any work at all, or whether it is soaking up a residual that something else explains better.
| British pole | Iberian pole | Iberian share | Residual |
|---|---|---|---|
| Medieval Irish, Kilteasheen | Galicians | 1.17% | 12.86 |
| Medieval Irish, Kilteasheen | Portuguese | 0.62% | 12.88 |
| Medieval Irish, Kilteasheen | Andalusians | 1.18% | 12.85 |
| Medieval Irish, Kilteasheen | Basques of Spain | 3.21% | 12.65 |
| Medieval Irish, Davidski average | Galicians | 0.00% | 10.75 |
| Medieval Irish, Davidski average | Andalusians | 0.00% | 10.75 |
| Scots | Galicians | 0.00% | 6.18 |
| Scots | any of eight Iberian poles | 0.00% | 6.18 |
Four British poles crossed with eight Iberian poles gives thirty two models. With the Kilteasheen average the Iberian share runs from 0.62 to 3.21 per cent. With Davidski's version of the same cemetery it runs from 0.00 to 1.58. With the Scots as the British pole the model returns exactly zero in all eight cases: it would rather explain the Irish as Scots than admit a single point of Spanish ancestry.
The second test is more decisive. If the small residual displacement of modern Irish people away from their medieval ancestors is genuinely Iberian, then adding an Iberian source should improve the fit. It should improve it more than adding sources that have nothing to do with Spain.
| Model for the modern Irish | Residual | R squared | R squared gain |
|---|---|---|---|
| Medieval Irish alone | 12.89 | 0.995472 | |
| plus a Galician source | 12.86 | 0.995494 | 0.000022 |
| plus a Portuguese source | 12.88 | 0.995479 | 0.000007 |
| plus an English source | 9.54 | 0.997519 | 0.002047 |
| plus a Norwegian source | 11.03 | 0.996684 | 0.001212 |
| plus English and Norwegian | 8.94 | 0.997825 | 0.002353 |
| plus English, Norwegian and Galician | 8.94 | 0.997825 | 0.002353 |
Adding a Galician source improves the fit by twenty two millionths. Adding an English source improves it by two thousandths, ninety three times more. And in the last row, once English and Norwegian sources are present, the Galician weight falls to exactly zero and the residual does not move by a thousandth of a unit. There is nothing left for Spain to explain.
The English and Norwegian weights in that table run at condition numbers between 23.8 and 59.5 and must not be quoted as admixture proportions; they are collinear and the split between them is arbitrary. What the table establishes is a ranking of explanatory power, and on that ranking Iberia comes last by two orders of magnitude. The small drift of the modern Irish away from their medieval ancestors points at Norse settlement, Anglo Norman arrivals and the British plantations, which is precisely what the published haplotype work on Irish population structure dates and describes.
The arithmetic nobody does
Now step back from the genomes and ask what size of signal the historical record could plausibly have produced.
Estimates for the population of Ireland around 1600 cluster near one million, with a wide range in the literature reflecting how thin the sources are. Against that, take the most generous possible reading of the Armada landings: assume a thousand Spanish men survived the wrecks, evaded the executions, stayed in Ireland rather than taking ship for Scotland, and every one of them fathered children who survived to reproduce. That is a far more favourable scenario than any historian would grant.
A thousand men entering a population of a million contribute, at the moment of arrival, one part in a thousand of the individuals and about one part in two thousand of the autosomal gene pool of the next generation, because they are men marrying local women. Five hundredths of one per cent.
The detection floor established above is three per cent. The maximal historically defensible Armada contribution is roughly sixty times smaller than the smallest thing this method can see.
What this method cannot say
That arithmetic cuts both ways, and it is important to be exact about which way. The strong form of the myth, that the Armada left a visible Spanish component in the population of western Ireland, is refuted: a component of that kind would have to be percentage points in size and there is nothing above the three per cent floor, nothing above the one per cent mark under most pole choices, and nothing at all under several. The weak form of the myth, that a handful of Spanish sailors survived, settled and have living descendants, is historically plausible, is entirely compatible with every number in this article, and is permanently invisible to any autosomal method. Sixteen generations of recombination reduce a single 1588 ancestor to roughly one part in sixty five thousand of a modern genome. No calculator will ever see that, and no calculator ever could. Anyone whose family tradition holds that they descend from a survivor of La Juliana should keep it. Nothing here contradicts it. What the data contradicts is the population level claim, and only that.
The older myth, which is more interesting
Behind the Armada story sits a much older one, and it has had a far more distinguished career.
The Lebor Gabala Erenn, the medieval Book of Invasions, has the Gaels arrive in Ireland from Iberia under the sons of Mil Espaine, whose name is simply the Latin for soldier of Spain. That is an eleventh century literary construction rather than a memory, but it proved remarkably persistent, and in 2006 it acquired a genetic afterlife. Bryan Sykes and Stephen Oppenheimer, working from Y chromosome frequencies, both argued that the British and Irish descend overwhelmingly from people who recolonised the Atlantic fringe from an Ice Age refuge in northern Iberia. The evidence was haplogroup R1b, which reaches world maxima in Ireland and also runs very high among Basques. The inference looked clean and it was repeated everywhere, including in Irish newspapers to this day.
Ancient DNA dismantled it. R1b in western Europe did not come out of an Iberian refuge; it arrived from the steppe in the third millennium BC. Olalde and colleagues, transecting eight thousand years of Iberian genomes, found that by around 2000 BC steppe related people had replaced about forty per cent of Iberia's ancestry and close to a hundred per cent of its Y chromosomes. Iberia and Ireland both have high R1b for the same reason, and neither got it from the other.
Global25 reproduces the geography of that arrival directly. The Rathlin Island men, three Early Bronze Age individuals from off the Antrim coast dated between about 2000 and 1500 BC, are the earliest Irish genomes carrying the ancestry that still characterises the island.
Global25 distances from the three Rathlin men to candidate source populations. Green marks Beaker and Bronze Age groups carrying steppe ancestry, orange marks the Beaker populations of Iberia that do not.
Rathlin sits 29.5 units from the Early Bronze Age Netherlands, 29.8 from Beaker burials in the Grand Est of France, 29.9 from Beaker Luxembourg, 31.8 from Beaker England. The Beaker populations of Iberia without steppe ancestry, which is to say the people of the region where the Bell Beaker pottery style actually originates, sit between 178.6 and 192.6 units away. That is further than the Yamnaya of the Volga, at 133.8.
The Beaker phenomenon began in Portugal and travelled to Ireland. The people who arrived in Ireland with it did not. The pot moved one way through a network and the ancestry moved another, which is the same lesson our article on the Silk Road corridor arrived at from the opposite direction: material culture and gene flow are separate processes and only one of them is recorded in a genome.
The Iberian connection that is real
And yet there is one. It is just five thousand years too early to be about sailors.
Ireland's Neolithic began around 3800 BC with the arrival of farmers, and the twenty seven Middle Neolithic individuals now in Global25 include the people who built the passage tombs. Where do they sit?
Global25 distances from the Irish Middle Neolithic average. The megalith builders of Ireland belong to a western European farming cluster that includes Iberia and excludes the modern Irish entirely.
The Irish Middle Neolithic sits 11.6 units from the Swiss Late Neolithic, 14.3 from the Iberian Chalcolithic of Valencia, 14.6 from Catalonian Middle to Late Neolithic, 15.1 from a pooled Iberian Middle to Late Neolithic average, 16.4 from the French Middle Neolithic and 18.5 from the Portuguese Middle Neolithic. It sits 168.0 units from the modern Irish.
So the passage tomb builders of the Boyne valley did belong to the same broad population as the farmers of Iberia, part of a western Mediterranean and Atlantic farming world that stretched from Switzerland to Portugal and up the ocean coast. The megalithic architecture that runs along that coast is not a coincidence of design. There really is an Iberian thread in Irish prehistory, and it is a good deal more impressive than a shipwreck.
It also happens to be where the phenotype comes from, if the phenotype comes from anywhere. Cassidy and colleagues sequenced the Neolithic woman from Ballynahatty in County Down and could deduce that she had dark hair, most likely black, at a probability of 86 per cent, and brown eyes at 97 per cent. The three Bronze Age men from Rathlin carried blue eye alleles, the most common Irish Y chromosome type, and the haemochromatosis variant that is so frequent in Ireland it is sometimes called a Celtic disease. The dark haired Irish person and the light haired Irish person are not a Spanish sailor and a native. They are two ancestries that met around 2500 BC and have been mixing ever since.
Deep ancestry, and why an Iberian graft is the wrong shape
One last check, using the standard three source panel this site applies to European topics, with the Yamnaya of Samara, the Anatolian Neolithic and the Loschbour hunter gatherer as poles. Its condition number is 2.43 and its pole separations are 338, 410 and 495 units, so the source matrix is very well conditioned.
Three source decomposition, identical panel for every row. The Irish and the Iberians differ by roughly nineteen points of steppe ancestry in the direction opposite to the one the myth requires.
The modern Irish come out at 50.7 per cent Yamnaya, 36.5 per cent Anatolian Neolithic and 12.7 per cent hunter gatherer. Galicians come out at 32.2, 57.0 and 10.9. Castilians, Portuguese and Andalusians are all within two points of the Galician profile.
Adding Iberian ancestry to an Irish population would push the steppe share down and the farmer share up. The Irish sit nineteen points of steppe above the Iberians, and above their British neighbours as well: the English and Welsh return 47.5 and 47.6 per cent steppe against the Irish 50.7. The Irish are not a slightly Iberian version of the British. They are the least Iberian shifted end of the same cline, and the direction of the offset is the wrong sign for the story.
Note also the medieval to modern comparison in that chart. Kilteasheen returns 51.3 per cent steppe and 35.7 per cent farmer; the modern Irish return 50.7 and 36.5. Between the year 1000 and today the Irish gene pool moved by 0.6 and 0.8 points on those two components. Whatever the last millennium did to Ireland, and it did a great deal, it barely touched the deep composition.
What is left unanswered
Three limits, stated before anyone else states them.
Global25 has no province level Irish samples. The specific version of the myth that concerns Sligo, Mayo, Clare and Galway therefore cannot be tested here with a western Irish target, and the eighty five individuals carry no regional labels. What can be said is that the published haplotype work points the opposite way: Byrne and colleagues, clustering 1,035 Irish genomes with fineSTRUCTURE, found twenty three geographically coherent clusters and reported that diversity is highest in the west while the east has been homogenised by historical migration, with a west to east cline of Celtic to British ancestry. The west of Ireland is the least admixed part of the island, not the most.
At the individual level this method is much blunter than it is at the population level. Simulating Irish individuals with a genuine Spanish grandparent, a quarter of the genome, the model catches every one of them. With a Spanish great grandparent, one eighth, it catches about six in ten. At one sixteenth it is essentially blind. So the individual scan above rules out recent Spanish ancestry in the sampled Irish and says nothing whatever about 1588.
And the baseline is one cemetery. Kilteasheen is a good pre Armada Irish population and it is the only one of usable size, but a second medieval Irish cemetery from a different province would make the zero point of every model here considerably more secure.
Myth and measurement
| The received story | What the genomes record |
|---|---|
| Dark featured Irish people from the western counties descend from Armada survivors. | The Irish are the least Iberian shifted population in northwestern Europe, at 1.2 on an axis where the English sit at 13.4. The detection floor is three per cent. |
| The Irish are more southern looking than their British neighbours, so they must carry more southern ancestry. | They carry less. Irish 1.66, Scots 5.27, English 10.93, Welsh 13.11 across 152 individually genotyped genomes, with p values down to 7.9 times ten to the minus seven. |
| A small Spanish component would be too subtle for a coordinate calculator to detect. | The estimator recovers a half per cent injection as a half per cent, and would catch a three per cent component in 97 runs out of 100. The problem is not sensitivity. |
| The Gaels came from Iberia, as the Book of Invasions says and as R1b frequencies seemed to confirm. | R1b reached both Ireland and Iberia from the steppe. The Iberian Beaker populations sit 179 to 193 units from the Irish Bronze Age, further away than the Yamnaya of the Volga. |
| Any Irish link to Iberia is romantic nonsense. | It is real and it is Neolithic. The Irish passage tomb builders sit 14 to 18 units from Iberian Neolithic and Chalcolithic populations, inside one Atlantic farming world. |
The underlying reason the myth survives is not stupidity, it is a category error that is very easy to make. Ireland is genuinely variable in pigmentation, more so than its reputation suggests, and human beings are extremely good at noticing that variation and extremely bad at estimating how old it is. A dark haired child in Mayo is evidence of something. It is just evidence of the Neolithic, arriving by sea from the same general direction, four thousand seven hundred years before the wind blew twenty four ships onto the rocks at Streedagh.
The coordinates
Every population referenced above, in Global25 scaled format, for anyone who wants to reproduce the models in Vahaduo. Coordinates are merged first occurrence wins from the Davidski Global25 files, the Moriopoulos 2026 collection and the dated ancient sample file.
Irish_(n=106),0.133453,0.134413,0.0616935,0.0491697,0.0376636,0.0193607,0.00314988,0.00466413,0.00365028,0.00266225,-0.00674275,0.00580583,-0.0141729,-0.0138804,0.025808,0.00529827,-0.0106913,0.00189756,0.000913734,0.00180714,0.00493851,0.00150753,0.000662714,0.0145304,0.000808434
Irish_Davidski,0.133361,0.134098,0.061169,0.048864,0.037788,0.019352,0.003293,0.004713,0.003568,0.002927,-0.006971,0.00584,-0.014189,-0.014076,0.025935,0.005215,-0.011145,0.001894,0.000597,0.001776,0.005114,0.001279,0.000293,0.014407,0.000661
Ireland_Medieval_Kilteasheen_(n=29),0.124734,0.130933,0.0600923,0.0519696,0.0378214,0.0188492,0.000818483,0.00533134,0.00388586,0.00113741,-0.00572286,0.00724014,-0.0158606,-0.0179098,0.0255529,0.00809252,-0.00797134,0.00199214,0.00233193,0.00351024,0.00434159,0.00406769,0.00175952,0.0117464,-0.000128
Ireland_Medieval_Kilteasheen_Davidski,0.126579,0.131529,0.0600402,0.0508447,0.0368238,0.0178875,0.000705,0.0048618,0.0043937,0.0011438,-0.0062604,0.0071419,-0.0153941,-0.0164436,0.0252954,0.007832,-0.0080209,0.0015596,0.0018855,0.0036828,0.0051288,0.0038034,0.0013388,0.0119334,-0.0005368
Ireland_EBA_Rathlin_(n=3),0.124826,0.125926,0.061219,0.061693,0.031391,0.020731,0.003368,0.006077,-0.001363,-0.001762,-0.000054,0.007494,-0.013330,-0.027846,0.031894,0.025369,0.003086,0.010050,0.002179,0.011631,0.009733,0.010758,0.001356,0.013656,0.003393
Ireland_EBA_(n=2),0.126343,0.129988,0.0607165,0.0644385,0.0296975,0.022172,0.0019975,0.006,0.002761,-0.0058315,-0.00138,0.0086925,-0.009737,-0.0165835,0.0229365,0.0146515,-0.003716,0.006968,0.0011315,0.0049395,0.006613,0.00643,0.00228,0.0110255,-0.0029335
Ireland_MN_(n=27),0.126428,0.170534,0.0531182,-0.0370014,0.0856797,-0.0239226,-0.00302019,0.00106833,0.0614405,0.0876488,-0.001654,0.0134935,-0.028339,-0.0119681,-0.00996289,0.00248978,0.0126472,0.00437785,0.00304944,-0.00156556,0.0107819,0.00505137,-0.0143013,-0.0321287,0.00150793
Ireland_Mesolithic_(n=2),0.126344,0.116278,0.197611,0.198161,0.163107,0.0612165,0.018801,0.0369215,0.092138,0.0092025,-0.011692,-0.0152115,0.0183595,0.0012385,0.060124,0.057544,-0.00841,0.012289,-0.0057825,0.054776,0.106936,0.0123035,-0.049299,-0.169964,0.0217345
Scottish_(n=41),0.131535,0.134223,0.0622801,0.0475361,0.0385661,0.0173592,0.0035938,0.00519493,0.00406056,0.00315576,-0.0057509,0.00523437,-0.0124078,-0.0133259,0.0233836,0.00480237,-0.00973107,0.00284283,0.00241898,0.00225112,0.00380117,0.00336576,-0.00069139,0.0150682,-0.00111568
Welsh_(n=22),0.131631,0.138657,0.0601971,0.0432844,0.0407775,0.0166054,0.00315917,0.00612506,0.00611536,0.00409949,-0.00435344,0.00574232,-0.0129775,-0.0102771,0.0207536,0.00492861,-0.00959964,0.0027412,0.00313507,0.00193205,0.00496805,0.00398735,0.000280397,0.011509,0.00110658
English_(n=44),0.131362,0.137466,0.0599194,0.0427021,0.0400354,0.0162898,0.00402705,0.00649275,0.00519675,0.00527241,-0.0059825,0.00538155,-0.0133963,-0.010697,0.0197905,0.00709657,-0.00565693,0.00241277,0.00287398,0.00367211,0.00572852,0.00256852,-0.00185989,0.0125153,0.000255932
Cornish_(n=15),0.130365,0.138924,0.0607667,0.0435189,0.0413615,0.0158409,0.00335267,0.0063074,0.00662667,0.00711927,-0.00526127,0.0057948,-0.0136867,-0.0111841,0.0209915,0.0035358,-0.0115347,0.00171447,0.0036788,0.0030848,0.00534887,0.00367653,-0.0005094,0.0133672,0.000495067
Breton_Finistere_(n=17),0.131968,0.136499,0.0611156,0.042883,0.0389575,0.0159952,0.00517,0.00525324,0.004704,0.00657129,-0.00693494,0.00521888,-0.0159066,-0.0131875,0.0212683,0.00463288,-0.00648076,0.000782412,0.000850235,0.003737,0.00314147,0.00288765,-0.000434941,0.0101006,0.00113412
French_Brittany,0.131466,0.13834,0.05785,0.039285,0.039169,0.015813,0.003155,0.004211,0.008186,0.00949,-0.005131,0.00559,-0.014368,-0.013102,0.018343,0.004399,-0.007302,0.00128,-0.000462,0.001773,0.004467,0.001787,-0.001254,0.010547,0.000659
Norwegian,0.132092,0.129455,0.068051,0.054531,0.040323,0.019871,0.00416,0.006092,0.006151,-0.002287,-0.004644,0.004275,-0.009236,-0.01015,0.020253,0.006557,-0.0072,0.00331,0.002976,0.004108,0.005681,0.00409,0.000887,0.014107,-6.9e-05
Dutch,0.127441,0.134179,0.060271,0.044076,0.040844,0.016397,0.005402,0.007263,0.004209,0.001924,-0.005635,0.004427,-0.009846,-0.008676,0.01783,0.005623,-0.006516,0.001748,0.003909,0.002816,0.00448,0.003385,-5e-06,0.013892,-0.000656
Spanish_Galicia_(n=19),0.108372,0.145809,0.0410465,-0.001088,0.0409955,-0.000308211,-0.00502158,0.00239268,0.0244783,0.0295606,-0.00229911,0.00584474,-0.0124483,-0.0124585,0.010829,0.000683895,-0.00385663,-0.00208026,-0.00465732,-0.00121121,0.000735526,-0.00263579,-0.000914632,-0.00340563,0.00120363
Spanish_Asturias_(n=4),0.10927,0.148775,0.0451602,0.000969,0.050009,-0.00390425,-0.00182125,0.004442,0.026128,0.0309345,-0.00690175,0.00768075,-0.0205152,-0.0115947,0.0107218,-0.002917,-0.00492225,0.00038,-0.00201125,-0.00181325,-0.00028075,-0.00401875,0.0018795,0.0018375,0.002844
Spanish_Cantabria_(n=15),0.115568,0.146033,0.0441734,0.000344533,0.0466958,-0.00353267,-0.00100267,0.00193847,0.0256064,0.0329361,-0.00475253,0.00829267,-0.0159067,-0.0145696,0.0101247,-0.000194533,-0.00261627,-0.000895267,-0.00337693,-0.00362673,0.0030446,-0.00213513,-0.00493807,-0.0040728,-0.000670667
Spanish_Castile_and_Leon_(n=7),0.10862,0.144786,0.0403519,-0.00235329,0.0426451,0.000398571,-0.00268571,0.00263714,0.0252147,0.0285069,-0.00417586,0.00631586,-0.0133371,-0.010125,0.0109547,-0.00405357,-0.00394871,-0.00267857,-0.00276543,-0.002912,-3.55714e-05,-0.00148371,-0.000986,-0.00215157,0.00188186
Spanish_Andalusia_(n=33),0.107959,0.145559,0.0363864,-0.00415985,0.0441293,-0.00562003,-0.00245682,0.0025173,0.0245056,0.0320128,-0.00204709,0.00633064,-0.0124018,-0.011481,0.00964845,-0.00132194,-0.00575276,-0.00131682,-0.00403752,-0.00147791,0.00261282,-0.000670758,-0.00182627,-0.00391418,0.00120467
Spanish_Valencia_(n=17),0.116635,0.146117,0.0395533,-0.001615,0.0449676,-0.00218182,-0.00215647,0.00172388,0.0233639,0.0321701,-0.00320953,0.00837494,-0.013056,-0.0134626,0.00836671,0.000452471,-0.00171029,-0.00152035,-0.00124218,-0.000632706,0.004059,-0.00221853,-0.00154424,-0.004678,0.00125382
Spanish_Catalonia_(n=9),0.120659,0.146586,0.0425022,0.00448878,0.0437126,0.000343111,-0.000746222,0.00300556,0.0204857,0.0308032,-0.00238456,0.00874378,-0.0165274,-0.0144997,0.00859389,0.00737789,0.00417767,-0.000739222,-0.000690667,0.00167011,0.00576622,-0.00372133,-0.00107789,0.000792778,0.000985556
Basque_Spain_(n=25),0.125479,0.148958,0.0544109,0.00854012,0.0541269,0.00059132,-0.0006298,0.00081216,0.0289768,0.0417466,-0.00528736,0.0103828,-0.0249632,-0.0186396,0.0152658,0.0019464,-0.00584644,0.00297968,-0.00213696,-0.00316148,0.00836528,0.00164704,-0.00701032,-0.00850236,0.00085736
Portuguese_(n=54),0.10437,0.144895,0.0371735,-0.00340899,0.0422048,-0.00337789,-0.00340194,0.00299707,0.0258392,0.0290406,-0.00235578,0.00623217,-0.0122222,-0.0111966,0.0107996,-0.00151834,-0.00307981,-0.000967924,-0.00436719,-0.000831913,0.00174452,-0.00232029,0.00125291,-0.00183611,-0.000363406
Netherlands_EBA,0.124067,0.12491,0.0646133,0.064923,0.0245177,0.0219393,0.0059533,0.0098457,-0.0029313,-0.0141537,-0.0042763,0.0018483,-0.006442,-0.0236253,0.0227107,0.0143637,0.0036073,-0.0002533,0.0011733,0.0116723,0.0010813,0.003215,0.0063267,0.007551,0.0030733
England_Bell_Beaker_(n=31),0.126784,0.123076,0.0633928,0.0685489,0.0262083,0.0232288,0.00202403,0.00352094,-0.00464465,-0.0106814,-0.00330532,0.00369835,-0.0101474,-0.0152584,0.0259839,0.00999984,-0.00656968,0.00181858,0.00253426,0.00582132,0.00631539,0.00284006,0.000286258,0.00571006,-0.000672161
France_Bell_Beaker_Grand_Est_(n=5),0.129531,0.126941,0.0586046,0.0592382,0.029236,0.0196896,0.002679,0.0027692,0.0067902,-0.0108612,-0.0041896,0.0029672,-0.0106736,-0.0172304,0.020711,0.0129406,0.0084488,0.001039,0.005732,0.0080038,0.0070378,0.0029184,0.0007886,0.0078802,0
Spain_Madrid_Bell_Beaker_(n=4),0.13175,0.148521,0.0641105,0.0139697,0.0535485,0.00376525,-0.002409,0.0062305,0.026435,0.042461,-0.00507475,0.0130758,-0.0249005,-0.020678,0.0089915,-0.00043075,0.0033575,0.00117175,-0.00047125,0.003533,0.00611425,0.0022565,-0.00382075,-0.0128632,0.00374225
Portugal_Bell_Beaker_NoSteppe_(n=3),0.122929,0.163839,0.055814,-0.0289623,0.0796043,-0.0194293,-0.00971367,0.00123067,0.0585617,0.0923327,-0.005413,0.015836,-0.0378093,-0.0231207,-0.001674,0.00304933,0.0132993,-0.00320967,0.00389633,0.00179267,0.0145577,-0.00107167,-0.0133107,-0.036471,0.00131733
Spain_Castile_Bell_Beaker_NoSteppe_(n=3),0.124826,0.163162,0.0602137,-0.0265937,0.0852467,-0.0190577,-0.005405,0.00146167,0.0720607,0.0867443,-5.4e-05,0.0163357,-0.0306737,-0.0223867,-0.000407,0.00755733,0.00990933,0.00173167,-0.00490233,-0.009671,0.016013,-0.00144267,-0.0170083,-0.0455487,0.00730467
Spain_MLN,0.126005,0.167535,0.0544786,-0.0351808,0.0875173,-0.0229068,-0.0067326,0.0013409,0.0658512,0.0929355,-0.0019531,0.0151204,-0.0316567,-0.0155328,-0.0052491,-0.0007991,0.0083905,0.0039889,0.0005402,-0.0036639,0.0124241,0.0042944,-0.0161788,-0.0393479,0.0023756
Spain_Valencia_CA_(n=16),0.126486,0.16972,0.0507227,-0.0418487,0.085516,-0.0255534,-0.00405381,0.000793187,0.0656904,0.0938858,-0.00201956,0.0167289,-0.0325103,-0.0167126,-0.00677756,0.00198056,0.00841775,0.00240712,0.00268681,-0.00264987,0.00993563,0.00260444,-0.0140581,-0.0366243,-2.25625e-05
Portugal_MN_(n=15),0.123915,0.161401,0.0529226,-0.0330537,0.0858622,-0.0243007,-0.00282,0.00307667,0.0672611,0.0924665,-0.000541333,0.014707,-0.0318631,-0.0152303,-0.0059898,-0.000309467,0.0068234,0.00119933,0.0019022,-0.00426027,0.0124695,0.003215,-0.0154963,-0.0402789,0.00212353
Switzerland_LN_(n=41),0.126871,0.170981,0.0503502,-0.0423524,0.0828447,-0.0271204,-0.0047288,0.00320815,0.0611527,0.0876778,0.000194122,0.0151365,-0.0291447,-0.011896,-0.0111788,-0.000679171,0.00696427,0.00332171,0.00313941,-0.00494759,0.0110385,0.00381215,-0.0127727,-0.029869,0.000528683
France_MN_1,0.124826,0.172978,0.0516657,-0.0383293,0.0868877,-0.030585,-0.003055,0.0003847,0.064425,0.0945807,0.001732,0.0134877,-0.0312187,-0.0198177,-0.007374,0.0057017,0.014907,0.0034207,-0.000545,0.000667,0.0147653,0.0024733,-0.0161863,-0.0319323,-0.0008783
Russia_Samara_EBA_Yamnaya_(n=29),0.122654,0.0889813,0.0441102,0.114466,-0.0272623,0.0455458,0.00402745,-0.00237934,-0.0547278,-0.074654,0.000974276,-0.000547793,-0.000974034,-0.0217064,0.0368081,0.0121342,-0.00648776,-0.00174748,-0.00251393,0.0109277,-0.00380793,0.00126207,0.00980034,0.0198864,-0.00448017
Turkey_N_Anatolian_Neolithic,0.117902,0.180087,0.0034255,-0.101059,0.0512402,-0.0479692,-0.0037992,-0.006846,0.0361667,0.0806776,0.0082614,0.0113088,-0.0241636,0.0005791,-0.0427122,-0.0103696,0.0225564,0.0013883,0.0136487,-0.0104478,-0.0142612,0.0056932,-0.0049042,-0.0037505,-0.0044357
Loschbour_WHG,0.130897,0.109677,0.203645,0.198,0.162492,0.059125,0.015041,0.038075,0.100217,0.016219,-0.015427,-0.017235,0.019921,-0.001239,0.061346,0.07067,0.002608,0.007348,-0.008925,0.065406,0.117543,0.010387,-0.049422,-0.173639,0.019519
References
- IRELAND Cassidy, L. M. et al. 2016. Neolithic and Bronze Age migration to Ireland and establishment of the insular Atlantic genome. PNAS 113, 368 to 373.
- IRELAND Cassidy, L. M. et al. 2020. A dynastic elite in monumental Neolithic society. Nature 582, 384 to 388.
- IRELAND Byrne, R. P. et al. 2018. Insular Celtic population structure and genomic footprints of migration. PLoS Genetics 14, e1007152.
- BRITAIN Patterson, N. et al. 2022. Large scale migration into Britain during the Middle to Late Bronze Age. Nature 601, 588 to 594.
- IBERIA Olalde, I. et al. 2019. The genomic history of the Iberian Peninsula over the past 8000 years. Science 363, 1230 to 1234.
- BEAKER Olalde, I. et al. 2018. The Beaker phenomenon and the genomic transformation of northwest Europe. Nature 555, 190 to 196.
- STEPPE Haak, W. et al. 2015. Massive migration from the steppe was a source for Indo European languages in Europe. Nature 522, 207 to 211.
- HISTORY Barry, M. B. 2024. 1588, The Spanish Armada and the 24 Ships Lost on Ireland's Shores. Andalus Press, Dublin.
- HISTORY Chinchilla, P. L. 2024. Work on the Armada prisoners held in Ireland, reported at the National Monuments Service conference, County Sligo.
- HISTORY Cullen, L. M. 1975. Population trends in seventeenth century Ireland. Economic and Social Review 6, 149 to 165.
- CLAIM Oppenheimer, S. 2006. The Origins of the British. Constable, London.
- CLAIM Sykes, B. 2006. Blood of the Isles. Bantam Press, London.
- DATA Global25 coordinates by Davidski, Eurogenes Blog. Population averages from the Moriopoulos 2026 collection. Modelling performed in Vahaduo compatible format.