
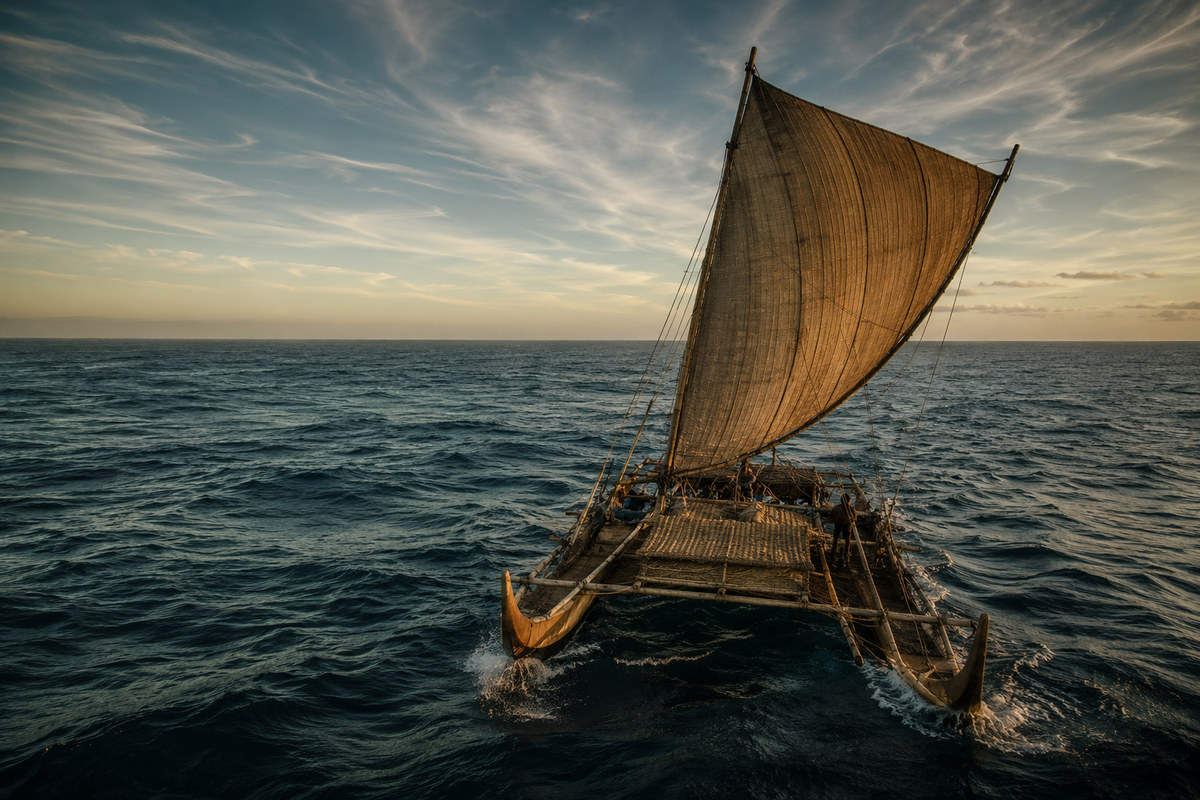
Three thousand years ago people pushed a canoe off a beach somewhere in the Bismarck Archipelago and sailed east into an ocean no human being had ever crossed. Within a few centuries their descendants had settled Vanuatu, Fiji and Tonga; a thousand years later others reached Hawaii, New Zealand and Rapa Nui. At roughly the same time a second branch of the same expansion sailed the opposite way, across the Indian Ocean, and landed on Madagascar. This article tests both crossings with a Global25 calculator, one model at a time. It finds that the first settlers of Remote Oceania carried no Papuan ancestry at all, that Vanuatu then lost almost all of its founding ancestry within three centuries, that every Polynesian population from New Zealand to Samoa sits in a band six points wide, and that Madagascar carries the same Austronesian signature with exactly zero Papuan component. It also finds that the one question everyone wants answered, whether Polynesians reached South America before Columbus, is one this method cannot answer, and the section explaining why is the most useful thing in the article.
One expansion, two oceans
The Austronesian expansion is the largest maritime dispersal in human prehistory. Between roughly five thousand and one thousand years ago, populations speaking related languages spread out of Taiwan through the Philippines and Island Southeast Asia and then across two oceans. By the end of it a single language family stretched from Madagascar off the coast of Africa to Rapa Nui off the coast of Chile, more than half the circumference of the planet.
The archaeology and the linguistics have never been seriously in doubt. The genetics has been messier, for a simple reason: almost every population involved is a mixture, and the sources of those mixtures are themselves closely related to one another. Taiwanese aborigines, Filipinos, Borneans and Malays all sit close together in coordinate space. Distinguishing which of them contributed to a given island is exactly the sort of problem where a careless model hands you a confident and completely wrong answer.
So the strategy here is to test claims that can fail. Every proportion below is checked against alternative source populations. Every claim of a zero is checked with a spike-in test that injects a known quantity of the missing ancestry and asks whether the model recovers it. And where the data genuinely cannot answer the question, this article says so rather than dressing an artefact up as a discovery.
The shape of the argument. One source region, two long-distance arms, and one ancestry component that separates them.
Data and method
Everything below uses Global25 scaled coordinates, merged in the standard priority order from Davidski's published files, the Moriopoulos 2026 collection and the dated ancient sample file. Ancestry proportions come from non-negative least squares with a sum-to-one constraint imposed by appending a heavily weighted row of ones, the resulting weights normalised. Distances are scaled Euclidean distances, quoted here in raw units rather than multiplied by a thousand, because the Pacific distances involved are large.
Two poles do the work in almost every model, so that rows are directly comparable. The Austronesian pole is the Igorot Kankanaey of Luzon, 21 individuals, which is the population published work identifies as the closest living match to Lapita burials. The Papuan pole is Papuan Highland, 7 individuals. Substitution checks run Atayal, Ami, Yami, Dusun and Murut against the first, and Papuan Coastal, Middle Sepik, Baining of New Britain and Nasioi of Bougainville against the second. Every two-source model below runs at a condition number between 1.3 and 1.7, which is about as well conditioned as this method gets. The single model that goes badly collinear is flagged in its own section.
Three honest notes before any number is used. Several of the modern Polynesian averages rest on very few individuals, six Tongans and three Tahitians among them. The Marquesan and Rapa Nui entries carry substantial recent European or Latin American admixture, which is stated in their labels and taken seriously below. And a Global25 coordinate is an autosomal summary with no dates attached and no way to distinguish maternal from paternal contribution, so every statement about sex bias or admixture timing in what follows comes from published work using other methods.
The first Remote Oceanians were not Polynesians
Start with the oldest people we can reach. The Teouma cemetery on Efate in Vanuatu and the Talasiu site in Tonga have both produced Lapita-associated burials around three thousand years old. These are the first human beings to live east of the Solomon Islands. If the familiar story of a slow island-hopping advance through New Guinea were right, they should look like a mixture of Asian and Papuan ancestry.
They do not. Here are the nearest populations in the entire merged panel to the Teouma individuals.
| Nearest to Teouma Lapita, Vanuatu 2900 BP | Distance |
|---|---|
| Guam Late Unai, Marianas, ancient | 0.0369 |
| Guam Latte, Naton Beach (63), ancient | 0.0403 |
| Saipan Latte, Anaguan (41), ancient | 0.0418 |
| Taiwan, Hanben Iron Age | 0.0440 |
| Yami, Orchid Island off Taiwan (16) | 0.0445 |
| Igorot Kankanaey, Luzon (21) | 0.0447 |
| Atayal, Taiwan | 0.0470 |
| Ma'anyan, Borneo (7) | 0.0853 |
| Samoan, modern (7) | 0.1508 |
| Tongan, modern (6) | 0.1976 |
| Papuan Highland (7) | 0.7593 |
The people buried at Teouma are four times closer to Taiwanese and Philippine populations than they are to modern Polynesians. The Tonga individuals give the same answer with a slightly different accent: their nearest living matches are the Luzon, Ilocano and Filipino averages at 0.039 to 0.044. This reproduces the finding of the original 2016 Lapita paper, which identified Kankanaey as the closest living population, and it does so with a different statistical method on a different marker panel. That kind of cross-validation is worth more than either result on its own.
Modelled as a two-source mixture, Teouma comes out at 99.3 per cent Austronesian and 0.7 per cent Papuan. Talasiu in Tonga gives 97.9 and 2.1. Within the resolution of the method these are zeroes.
Is the zero real, or is it a detection floor?
This is the question that has to be asked every time a model returns nothing, and it is the question most amateur analyses skip. A model that cannot see three per cent of anything will happily report zero per cent of everything.
The test is straightforward. Take the Teouma coordinates, mathematically inject a known fraction of Papuan Highland ancestry, and rerun the identical model. If the model recovers what was injected, the zero is real. If small injections vanish, the zero is an artefact.
Spike-in recovery for the two central negative results in this article. Injected and recovered fractions sit on the one to one line down to one per cent.
A one per cent injection comes back as 1.06 per cent. A three per cent injection comes back as 3.06. The detection floor is well below one per cent, and the observed zero is a real absence of Papuan ancestry rather than a limit of the instrument. The first people to cross into Remote Oceania had, as far as the autosomes can say, no Near Oceanian ancestry at all.
The Marianas, a second crossing nobody talks about
Before following the Lapita story forward it is worth pausing on a set of samples that most Pacific discussions ignore. The Mariana Islands, two thousand kilometres east of the Philippines, were settled around three and a half thousand years ago by a crossing at least as impressive as anything in the Lapita record, and one that had nothing to do with it.
The ancient Guam and Saipan individuals come out at 99.0 and 99.2 per cent Austronesian, with Papuan components of 1.0 and 0.8 per cent, statistically indistinguishable from zero on the calibration above. They are also the single closest population in the whole panel to the Teouma individuals, at 0.0369.
That is not because Guam and Vanuatu were in contact. It is because both were settled, independently and within a few centuries of each other, out of the same Philippine source pool. The published work on Micronesian ancient DNA reaches the same conclusion and notes that people of the Mariana archipelago may derive all of their pre-colonial ancestry from East Asian sources, making them the only Remote Oceanians without Papuan ancestry. Our result reproduces that exactly.
The Vanuatu turnover, in eleven data points
Vanuatu has the densest ancient DNA time series in the Pacific, which makes it the best place to watch what happened next. Running the same two-source model on every dated Vanuatu average from three thousand years ago to the nineteenth century produces one of the most dramatic curves in population genetics.
Austronesian share in Vanuatu through time. The 2700 BP point is the Tonga sample, included to show that the pre-turnover value was general across western Remote Oceania.
Between 2900 and 2600 years before present, Austronesian ancestry in Vanuatu falls from about 99 per cent to about 36. By 2300 years ago it is down to 15. It never recovers: the nineteenth century samples sit at 26 per cent and modern ni-Vanuatu are in the same range. Roughly three quarters of the ancestry of a modern Vanuatu population arrived after the islands were already inhabited.
The scatter after 2300 BP is real rather than noise. Different islands and different sites within the archipelago retain different amounts of the founding ancestry, which is why the curve bounces between 15 and 44 per cent instead of settling on a line. Recent work on seventy-two ancient genomes from the eastern Solomons, Vanuatu, Fiji and Tonga finds that the Papuan-related expansion proceeded more slowly than the Lapita expansion before it and reached Fiji through at least two distinct dispersals, centuries earlier than previously thought. A single clean replacement wave is the wrong mental model. This was a prolonged network of movements.
Two details deserve emphasis. The languages did not change: modern ni-Vanuatu speak Austronesian languages descended from those of the Lapita settlers, not Papuan languages, despite an overwhelming genetic turnover. And the published work finds the turnover was sex-biased, with incoming Papuan males and resident Austronesian females. Genetic replacement and cultural replacement are separate processes, and here they came apart completely.
Where Polynesians actually got their Papuan ancestry
Now the central puzzle. Modern Polynesians carry Papuan ancestry. The Lapita founders did not. Where did it come from, and when?
The full panel, ancient and modern, under the identical two-source model. Note how tightly the Polynesian rows cluster and how far they sit from Vanuatu and the Solomons.
The pattern in that chart is the answer. Look at the Polynesian block: Samoan at 80.3 per cent Austronesian, Tahitian at 78.6, Maori and Moriori at 78.3, four-hundred-year-old French Polynesian individuals at 77.4, Tongan at 74.0. Five populations spread across thousands of kilometres and several centuries, and the range is six percentage points.
Now look at Vanuatu, which lies directly on the supposed route and which those canoes had to pass: 26 per cent. And the Solomons at 53. If Polynesians had accumulated their Papuan ancestry gradually along the way we would expect a gradient, more Papuan ancestry in the west and less in the east. There is no gradient. There is a cliff.
What produces a flat plateau rather than a gradient is a single admixture event in a single ancestral population, followed by dispersal. The proto-Polynesian population formed once, somewhere in the western part of Remote Oceania or on its approaches, in a window between roughly 2500 years ago and the first settlement of East Polynesia. Everything east of that point is a series of founder events drawing on an already-mixed pool.
What this model cannot tell you
Substituting Papuan poles moves the Polynesian estimate between 19 and 30 per cent. Papuan Highland gives 19.7 for Samoans, Baining of New Britain gives 23.7, Nasioi of Bougainville gives 29.7, and the fit quality barely changes across all three. Global25 in this configuration therefore cannot identify which Near Oceanian population contributed the ancestry. Published haplotype-based work points to a Bismarck Archipelago source rather than the geographically closer Solomons, and that conclusion rests on evidence this method has no access to.
The signature of the canoe
There is one more thing hiding in these numbers, and it is arguably the most striking result in the article. It concerns not the composition of Polynesian populations but how little they differ from one another.
| Pair | Distance apart | G25 distance |
|---|---|---|
| Tahiti to New Zealand | 4,052 km | 0.0251 |
| New Zealand to Marquesas | 5,447 km | 0.0361 |
| Samoa to Tahiti | 2,465 km | 0.0213 |
| Samoa to New Zealand | 2,936 km | 0.0321 |
| Portugal to Greece | 2,594 km | 0.0575 |
| Portugal to Ireland | 1,534 km | 0.0827 |
| Greece to Norway | 2,515 km | 0.1112 |
New Zealand and the Marquesas are five and a half thousand kilometres apart, separated by nothing but open ocean, and their populations differ by 0.0361. Portugal and Ireland are fifteen hundred kilometres apart, connected by continuous coastline and three thousand years of continuous traffic, and differ by 0.0827. The Polynesian world, which looks on a map like the most fragmented human territory on earth, is genetically one of the most homogeneous.
That is what sustained two-way voyaging looks like in a genome. These were not one-way accidents. Islands that stay in contact stay genetically similar, and the Polynesian pattern is only compatible with a navigational tradition that could reliably find its way back.
Caveats on that table
The Samoan and Tongan averages rest on seven and six individuals respectively, and the Samoa to Tonga pair is an outlier at 0.0490 over only 886 kilometres, almost certainly sampling noise on top of genuine Tongan drift. The Marquesan samples carry European admixture, which inflates every distance involving them, so the fact that they still come in low is if anything a stronger version of the point. Treat the table as directional rather than as measurement.
Rapa Nui and the Americas, a negative methodological result
Now the question everyone actually wants answered. Did Polynesians reach South America before Columbus?
The circumstantial case is old and good. The sweet potato is a South American cultigen and it was growing across Polynesia before any European arrived. The Polynesian word for it, kumara, resembles Quechua words for the same plant. Thor Heyerdahl built a career on the idea, although he had the direction backwards: he argued that South Americans settled Polynesia, which the genetics comprehensively rejects.
The natural thing to do with Global25 is to model the Rapa Nui average with three sources: Polynesian, Spanish and Native American. That model returns 59.3 per cent Polynesian, 29.0 per cent Spanish and 11.6 per cent Native American. The Native American figure is tantalisingly close to the roughly ten per cent that published ancient DNA work reports, and it is very tempting to call it a confirmation.
It is not one, and here is why.
The collinearity trap
Rapa Nui was annexed by Chile in 1888 and has had continuous Chilean gene flow ever since. Chilean mestizo populations are themselves a mixture of Spanish and indigenous American ancestry. So the three-source model is being asked to separate a Spanish component from a Native American component when the actual historical donor carried both, in unknown proportions, arriving at an unknown date. Fitting the single Chilean mestizo sample in the panel with the same Spanish and Mapuche poles returns 78.9 per cent Spanish and 21.1 per cent indigenous, which confirms the overlap directly.
The way to test whether that matters is to build a Rapa Nui that we know contains zero pre-Columbian American ancestry, and see what the model says about it.
Synthetic islanders built from Polynesian ancestry plus a single post-1888 Chilean source, with no pre-Columbian contact at all, read by the same three-source model.
A Chilean source that is 70 per cent European, contributing 37 per cent of the genome, reproduces the observed Rapa Nui numbers to within a few points with no pre-Columbian contact whatsoever. Chilean populations do average in that range. The observed eleven to twelve per cent Native American signal is therefore fully explained by nineteenth and twentieth century admixture, and this test cannot distinguish that history from a pre-Columbian one. The measurement is not wrong. It is unfalsifiable, which in this context is worse.
And the sample has a second problem
There is also a straightforward data quality issue that any careful reader should be told about. Every Polynesian population in the panel, ancient and modern, sits between minus 0.046 and minus 0.061 on the twenty-fifth dimension of Global25 and between minus 0.022 and minus 0.031 on the twenty-second. The Rapa Nui average sits at plus 0.053 and plus 0.033. It flips sign on both, and no combination of Polynesian, Spanish and American sources can produce that. The best three-source fit leaves a residual of 0.11, roughly five times the residual for Samoans or Tongans under the equivalent model.
The entry is labelled as Latin American mixed, five individuals, and is very likely a merge of consumer-panel uploads with differing coverage and imputation. It is not a population average in the sense the other entries are. Nothing in this article rests on it.
| What Global25 can establish here | What only ancient DNA can establish |
|---|---|
| That the Rapa Nui sample carries Native American ancestry. That much is unambiguous. | When it arrived. Dating admixture requires the length distribution of ancestry tracts along the chromosome, information destroyed when a genome is compressed into twenty-five coordinates. The 2024 study that sequenced fifteen radiocarbon dated Rapanui individuals found roughly ten per cent Native American ancestry and dated the admixture to between 1250 and 1430, centuries before any European reached either island or continent. A separate 2020 study found the same signal across Rapa Iti, Tahiti, Palliser, Nuku Hiva, Fatu Hiva and Mangareva, with dates from about 1150 onward. |
So the answer to the question is almost certainly yes, Polynesians and Native Americans met before Columbus, and the evidence is strong. But it is not evidence this method produced, and pretending otherwise would be exactly the sort of overclaim that makes amateur population genetics deservedly easy to dismiss.
A curiosity worth flagging
Running a nearest neighbour scan on the Samoan average returns, in third place after Tahitians, two nineteenth century Botocudo individuals from Minas Gerais in Brazil, at distances of 0.0260 and 0.0364. These are the well known skulls from the Rio de Janeiro national museum that turned out to be genetically Polynesian. They are almost certainly a product of nineteenth century shipping rather than pre-Columbian voyaging, but they are a startling thing to find sitting next to Samoa in a distance table.
Madagascar, the same expansion sailing the other way
While one branch of the Austronesian world was working east across the Pacific, another crossed the Indian Ocean and settled an island off the coast of Africa, roughly eight thousand kilometres from any Austronesian homeland. Malagasy is not a distant relative of the Southeast Asian languages. It belongs to the Greater Barito subgroup, whose other members are spoken in southern Borneo.
The five Malagasy averages now available in the panel model cleanly as a two-source mixture.
Malagasy ethnic groups under a three-source model. The third source is present in the model and returns zero in every case.
The African share runs 62.8 to 65.1 per cent and the Austronesian share 34.9 to 37.2, with residuals of 0.012 to 0.016, which is an unusually good fit for a two-way mixture of this depth. That sits close to the published figures of roughly sixty per cent African and forty per cent Asian, and the direction of the discrepancy is expected: published work has identified strong recent selection favouring African ancestry in the Malagasy genome, driven by malaria resistance at the Duffy locus, which has reduced genome-wide Asian ancestry by around ten per cent.
Which Africans, and which Asians
Substituting African poles is decisive. Sena, Yao, Nyanja and Chewa, all from the Mozambique and Malawi region, fit at residuals of 0.0138 to 0.0145. Bantu Kenya fits at 0.0365. Xhosa and southeastern Bantu fit at 0.0508. The African contribution to Madagascar came across the Mozambique channel, not down from the Swahili coast of Kenya and not up from southern Africa. That is a clean geographic result falling straight out of the substitution test.
The Asian side is more delicate. A Malay proxy fits better than a Ma'anyan one, at 0.0138 against 0.0201. Published haplotype work identifies the Banjar of southeast Borneo as the specific source, and the Banjar are themselves an admixture of Malay and Ma'anyan, which is precisely why a Malay-shaped proxy outperforms a pure Barito one here. But a three-source model with both Malay and Ma'anyan runs at a condition number of 33.1 and improves the fit by 0.0001. That is a textbook collinearity trap: the two sources are close enough that the model can trade between them almost freely, so the resulting split of roughly 3 per cent Ma'anyan against 33 per cent Malay carries no information at all. It is reported here only so that nobody is tempted to quote it.
The component that is not there
This is the result that ties the article together. Adding Papuan Highland as a third source to the Malagasy model returns 0.00 per cent in all five ethnic groups, and improves the fit by exactly nothing. The spike-in calibration confirms that this model would recover a one per cent injection as 0.52 per cent and a two per cent injection as 1.52.
Meanwhile the identical three-source model reads 19 to 26 per cent Papuan in every Polynesian population tested.
The two arms of the Austronesian expansion therefore separated before the eastern arm acquired its Papuan ancestry. The Madagascar voyagers left Island Southeast Asia carrying the ancestral Austronesian profile intact, exactly as the Lapita founders had done a thousand or more years earlier, and picked up nothing Oceanian on the way because they never went that way. A single component, present at a quarter in one direction and at zero in the other, tells the whole story of the split.
Tested and rejected
Adding an Arabian source to the Malagasy model returns 1.3 to 1.6 per cent, which sounds like a plausible Indian Ocean trade signal. It is not. The spike-in test shows this model reads 1.54 per cent Arabian ancestry into a target that contains none by construction, so the observed value is precisely the noise floor. Given the documented Swahili and Arab trading presence in the region a real component may well exist. This method cannot see it, and reporting the 1.5 per cent as a finding would be reporting the error term of the model itself.
Readers who want the deeper Malagasy story, including the mitochondrial evidence for a founding population of roughly thirty women and the historical debate over how the African contribution arrived, will find it in the earlier article on this site devoted to the Malagasy people.
Myth and measurement
| The received story | What the genomes record |
|---|---|
| Polynesians are a Melanesian and Asian blend that formed gradually as canoes worked east through New Guinea and the Solomons. | The first crossing was made by a population that had picked up nothing on the way. Teouma at 2900 BP is 99.3 per cent Austronesian, and a spike-in test would have caught one per cent. |
| Polynesian ancestry proportions should show a gradient, more Papuan in the west and less in the east. | There is no gradient. Every population from New Zealand to Samoa sits between 74 and 80 per cent Austronesian, while Vanuatu on the same route sits at 26. |
| The Pacific islands were settled by one-way accidental drift voyages. | Populations five thousand kilometres apart differ less than Portugal and Ireland do. That pattern requires reliable two-way navigation. |
| Global25 modelling can settle whether Rapa Nui had pre-Columbian American contact. | It cannot. Simulated islanders with zero pre-Columbian ancestry reproduce the observed figures exactly. The question was settled by ancient DNA and haplotype dating instead. |
| Madagascar and Polynesia are two ends of one continuous Austronesian world. | They are two arms that separated before the eastern one met Near Oceania. Papuan ancestry runs at 19 to 26 per cent in Polynesia and at 0.00 per cent in all five Malagasy groups. |
The through-line is simple enough to state in a sentence. One population, expanding out of Taiwan and the Philippines, put people on islands from Madagascar to Rapa Nui within about four thousand years, and the differences between its descendants today are mostly a record of who they met after they arrived rather than of where they came from.
What still deserves emphasis is the scale of the thing. The people buried at Teouma three thousand years ago crossed several hundred kilometres of open water to reach an island they could not see and had no way of knowing existed. Their descendants kept doing it, in every direction, for the next two thousand years, and the flatness of the ancestry proportions across the Polynesian triangle says they kept coming back. Whether one of those voyages reached South America is a question ancient DNA has now answered in the affirmative. It would have been, by a considerable margin, the least surprising thing these people ever did.
The coordinates
Every population referenced above, in Global25 scaled format, for anyone who wants to reproduce the models in Vahaduo. Coordinates are merged first-occurrence-wins from the Davidski Global25 files and the Moriopoulos 2026 collection.
Igorot_Kankanaey_(n=21),0.0181575,-0.445672,-0.0446977,-0.0679069,0.143206,0.0642246,-0.00318929,-0.0174938,-0.028682,-0.0219725,0.0493274,0.00396071,-0.00649148,-0.00386648,0.013068,0.00747557,-0.00529619,0.00649124,0.0119473,-0.0166509,0.00482476,-0.0349525,-0.00257062,-0.00833143,-0.0706066
Atayal,0.015176,-0.444351,-0.042866,-0.068512,0.135034,0.060581,-0.002951,-0.014102,-0.022725,-0.019418,0.038161,0.004046,-0.003089,0.003074,0.013617,0.007882,-0.00452,0.004673,0.005475,-0.016063,0.003494,-0.02495,-0.000726,-0.006587,-0.050122
Ami,0.019236,-0.450083,-0.047291,-0.067669,0.142027,0.063727,-0.00557,-0.014884,-0.022559,-0.022579,0.047547,0.004676,-0.005545,-0.001968,0.007234,0.00411,-0.003312,0.004979,0.008547,-0.019409,0.010906,-0.028193,0.002539,-0.006109,-0.054175
Yami_(n=16),0.0155796,-0.445056,-0.0485779,-0.0657305,0.141065,0.0622101,-0.00613944,-0.0127638,-0.0246068,-0.019169,0.0450527,0.00295975,-0.00299175,-0.00208163,0.00737125,0.00459919,-0.00570425,0.00812394,0.00872819,-0.0169457,0.0067225,-0.0272576,0.00236475,-0.00830681,-0.0542316
Papuan_Highland_(n=7),-0.043578,-0.23865,-0.261722,0.307912,0.210325,-0.516386,0.00191357,0.005769,-0.0439143,-0.012184,-0.0158213,0.00149871,0.00144414,-0.00322429,0.0019,-0.00244357,-0.00210471,-0.000108714,-0.000125571,-0.00485957,0.00176471,0.00438086,-0.000475429,-0.000550857,0.00494386
Papuan_Coastal_(n=10),-0.0349438,-0.260483,-0.23472,0.258498,0.198529,-0.430635,-0.0019035,0.0029075,-0.0354646,-0.0114444,-0.0065767,0.0019483,0.0038948,-0.002147,0.0009363,-0.0005702,-0.0031943,-0.0026098,-8.78e-05,-0.0039895,0.0009357,-0.0036848,0.0037343,-3.62e-05,-0.0058437
Baining_(n=38),-0.0387298,-0.237687,-0.226153,0.250547,0.168242,-0.38073,0.00193566,0.00568389,-0.0225246,-0.00309789,-0.00167084,-0.00177474,0.00356008,-0.00323784,-0.00179639,-0.00129808,0.00293368,-0.00105005,-0.000651684,0.00139203,-0.00310305,-0.00190034,-0.00276016,-0.00318987,-0.00518382
Nasioi_(n=16),-0.030163,-0.270194,-0.187311,0.184575,0.154067,-0.287048,0.00381875,-0.00128356,-0.0188161,-0.00683381,0.00989544,0.000121625,-0.00123581,0.000662313,-0.00184069,-0.001939,-0.0005705,0.00180525,0.00277331,0.000359625,-0.00022625,-0.00491513,-0.00288088,-0.00223675,-0.0132247
Vanuatu_3000BP,0.020488,-0.433631,-0.053174,-0.061047,0.15049,0.04267,0.00141,-0.003,-0.00634,-0.012574,0.062357,0.012289,-0.018583,-0.0139,0.018051,0.000133,-0.012126,0.01875,0.007165,-0.006753,0.008235,-0.028687,0.0053,-0.007591,-0.062749
Vanuatu_2900BP,0.012521,-0.423476,-0.033187,-0.074936,0.15049,0.059125,-0.015041,0.000692,-0.023316,-0.010023,0.056511,0.008992,-0.009068,-0.002615,0.0095,0.01074,0.005737,0.008615,0.003394,-0.019134,0.00574,-0.031037,-0.013804,-0.011327,-0.060593
Tonga_2700BP,0.009106,-0.414336,-0.051288,-0.055879,0.140642,0.066376,-0.00329,-0.007615,-0.020248,-0.011481,0.047905,0.017085,-0.010704,-0.013212,0.020629,0.011403,-0.002477,0.008868,0.011061,-0.018884,-0.006613,-0.020155,-0.012448,-0.013014,-0.066581
Tonga_2500BP,0.013659,-0.430584,-0.052043,-0.045866,0.153567,0.057173,0.003995,-0.016153,-0.031088,-0.024055,0.05505,0.006894,-0.00223,-0.016652,0.016286,0.007292,-0.009909,0.007855,0.007668,-0.010255,-0.000125,-0.031655,-0.002588,-0.017713,-0.058677
Vanuatu_2500BP,-0.033578,-0.273178,-0.191012,0.193478,0.163723,-0.324071,-0.002115,-0.0027695,-0.026077,-0.014032,0.0107175,0.008243,0.008102,-0.003028,-0.001086,-0.0046405,-0.0048245,-0.002914,0.0035195,0.0013755,-0.001747,-0.002844,-0.0070865,-0.0077115,-0.0211955
Vanuatu_2300BP,-0.042115,-0.227479,-0.232306,0.254525,0.180957,-0.410527,0,0.005538,-0.028633,-0.011663,-0.003248,0.005995,0.001041,-0.000826,-0.002307,-0.001326,-0.003781,-0.005954,-0.006788,0.005378,0.006613,-0.009274,0.001972,-0.001205,-0.008622
Vanuatu_1300BP,-0.0387,-0.241696,-0.219484,0.244835,0.170801,-0.382359,0.005875,0.004615,-0.02577,-0.004738,-0.004547,0.002847,-0.001635,-0.008808,-0.011808,-0.001193,0.008345,0.002914,0.002263,-0.002376,-0.00025,-0.001855,0.000123,-0.006868,-0.002515
Vanuatu_150BP,-0.037334,-0.255507,-0.208774,0.221191,0.162492,-0.344207,-0.003572,0.0015228,-0.0268744,-0.0074354,-6.5e-05,-5.98e-05,0.0030924,0.0023398,0.0001086,0.000212,-0.0014342,-0.0006334,0.005028,0.002051,-0.0004742,-0.004031,-0.0005672,-0.0054946,-0.009436
Guam_Latte,0.0133602,-0.444535,-0.0512513,-0.0647218,0.146458,0.0616943,-0.0059445,-0.0106831,-0.0225445,-0.0270396,0.0575813,0.0052207,-0.0061097,-0.0030705,0.0137789,0.0085552,-0.0033622,0.0064777,0.0109625,-0.0139001,0.0049994,-0.034785,-0.0094739,-0.0090589,-0.0637658
Northern_Mariana_Islands_Saipan_Latte_Anaguan_(n=41),0.016185,-0.445372,-0.0511872,-0.0636152,0.145018,0.0600295,-0.00577193,-0.0100802,-0.0233507,-0.0270687,0.0535248,0.00537698,-0.00613129,-0.00403134,0.0141249,0.0101772,-0.00439493,0.00654761,0.0105433,-0.0152543,0.00426385,-0.0334706,-0.00891593,-0.00901371,-0.0639844
Solomon_Islands_500BP_(n=1),-0.015935,-0.313799,-0.151225,0.116604,0.157568,-0.189646,-0.002585,-0.004615,-0.016771,-0.010023,0.014777,0.002698,-0.007284,0.003303,0.008415,-0.000796,0.004563,0.003927,0.003017,-0.004877,-0.000374,-0.00915,-0.007148,-0.009158,-0.022154
Micronesia_Pohnpei_400BP,-0.0045527,-0.387255,-0.107982,0.036822,0.158696,-0.084132,-0.0047783,-0.009692,-0.0287697,-0.0193167,0.0399473,-9.97e-05,-0.0056487,0.0016517,0.0071027,0.0075577,-0.0006083,0.0086147,0.006285,-0.008754,0.0022463,-0.0257197,-0.0061623,-0.0098007,-0.048618
French_Polynesia_400BP,-0.004553,-0.364575,-0.087492,0.01615,0.145258,-0.054941,-0.004465,0.009692,-0.027406,-0.017495,0.026469,0.006744,0.002973,-0.012386,0.01045,0.009944,-0.002217,0.008108,0.000126,-0.001876,0.014849,-0.026709,-0.002588,-0.00253,-0.043948
French_Polynesia_150BP_(n=1),-0.005691,-0.366606,-0.087869,0.016796,0.143411,-0.055499,-0.006345,0.007615,-0.026997,-0.017312,0.030529,0.008692,0.001338,-0.01156,0.010722,0.010872,-0.002738,0.008488,-0.001383,-0.001376,0.01123,-0.027698,-0.003821,-0.001928,-0.044427
New_Zealand_Early-Late_Modern_Maori/Moriori_(n=2),0.0028455,-0.376762,-0.089755,0.0172805,0.148181,-0.0518735,-0.0094005,-0.009692,-0.026179,-0.0195905,0.0383235,0.00562,-0.0043115,-0.00578,0.0093645,0.008618,-0.0035205,0.000887,0.0093015,-0.002376,-0.0006865,-0.025967,-0.0030815,-0.0071695,-0.0461635
Samoan_(n=7),0.00227629,-0.399538,-0.0916403,0.00687529,0.151677,-0.0458179,-0.000906429,-0.00728514,-0.0255654,-0.0166354,0.0414554,0.00697943,-0.00569157,-0.00141543,0.006941,0.0104367,-0.002645,0.003131,0.00423771,-0.0128991,0.00390386,-0.0221867,-0.00463029,-0.007247,-0.0524503
Tongan_(n=6),0.000569,-0.383362,-0.104525,0.0305773,0.157876,-0.0818545,-0.0015275,-0.00407667,-0.0277812,-0.0184665,0.0407593,0.006794,-0.00445983,-0.0016515,0.005836,0.00715983,-0.00262917,0.00557433,0.00634783,-0.00994217,0.0025165,-0.0231437,-0.00363583,-0.00706917,-0.0480398
Tahitian_(n=3),0.00341467,-0.394364,-0.091389,0.0144273,0.144129,-0.056429,-0.00783367,-0.00415367,-0.02652,-0.0187093,0.035509,0.00534533,-0.00247767,-0.002982,0.00891233,0.0106513,-0.000261,0.003125,0.00565633,-0.012631,0.00781967,-0.024854,-0.000986,-0.00723,-0.0462237
Micronesian_Central_(n=3),-0.000758667,-0.384209,-0.107479,0.038437,0.157876,-0.0825513,-0.00336833,-0.00830733,-0.025702,-0.0227187,0.030367,0.00159867,-0.00416233,-0.00160567,0.010722,0.003359,-0.00147767,0.004772,0.00657833,-0.008504,0.000124667,-0.026297,0.00324533,-0.00859533,-0.0477
Rapa_Nui_(Latin_American-Mixed)_(n=5),0.0460052,-0.238069,-0.0406232,0.044097,0.090743,-0.0256334,-0.029691,-0.0378612,0.0069282,0.0029816,0.0010638,0.0038544,0.0001836,-0.007928,-0.0076458,0.0020486,0.0025382,-0.011643,-0.0102358,0.0139276,-0.0082026,0.0332552,0.0019506,0.005537,0.0532512
Malagasy_Mikea_(n=15),-0.39785,-0.0868615,-0.0129981,-0.0054264,0.0430849,0.0271081,-0.0107791,0.011415,-0.0203843,-0.000364467,0.0250944,0.00552527,-0.00908813,-0.00134867,-0.00978087,0.0123839,-0.0072668,0.00695107,-0.0027654,0.005511,-0.00146393,-0.00553153,-0.00340153,-0.000289267,-0.00522107
Malagasy_Vezo_(n=21),-0.383584,-0.0973941,-0.0152463,-0.0073521,0.0460598,0.0282211,-0.0115491,0.00970295,-0.0187675,-0.00192643,0.0261522,0.00431057,-0.0108168,0.000793,-0.00786524,0.00993795,-0.00887243,0.00635252,-0.00662014,0.00320986,-0.00347605,-0.00515233,-0.00219495,-0.00115914,-0.00498371
Malagasy_Temoro_(n=24),-0.392121,-0.0923709,-0.0146448,-0.00501996,0.0445852,0.0256695,-0.00988,0.00989387,-0.0202478,-0.000865583,0.024656,0.0022855,-0.0111247,0.00333158,-0.00804704,0.00917079,-0.0120225,0.00766458,-0.00353529,0.00361629,-0.000644708,-0.005348,-0.00166888,-0.00177229,-0.00375217
Malagasy_Sofia_(n=9),-0.384849,-0.095911,-0.0133249,-0.00534744,0.0478722,0.0284778,-0.00960911,0.00956378,-0.0202252,2.03333e-05,0.0248994,0.00532856,-0.0124872,0.00111622,-0.00681622,0.00975256,-0.00947444,0.00553211,-0.00283522,0.00348778,-0.00421478,-0.00412189,-0.000999556,0.00319978,-0.003486
Malagasy_Toliara_(n=9),-0.397243,-0.0894796,-0.0119003,-0.00660356,0.0444186,0.0279511,-0.00997489,0.0104868,-0.0182936,-0.000162222,0.0228064,0.00477933,-0.0110999,-0.000810667,-0.0106617,0.0144227,-0.00333189,0.00494089,-0.00437156,0.00529411,-0.00343833,-0.00461633,-0.00328667,-0.000602444,-0.00572144
Sena_(n=20),-0.622783,0.0634706,0.0189504,0.0154878,0.00044625,0.0115461,-0.0139832,0.0227991,-0.0289402,0.0127564,0.00154265,0.002203,-0.0124206,0.00067425,-0.0183629,0.0146844,-0.0118061,0.0093434,-0.0091194,0.0049772,-0.00028695,-4.95e-05,0.0022986,-0.000253,0.0005508
Yao_(n=29),-0.626145,0.0629978,0.0203126,0.0151587,-0.000137931,0.0108479,-0.0112157,0.0201637,-0.0264471,0.00977162,7.83448e-05,0.00128159,-0.013687,0.00223048,-0.0184766,0.0132223,-0.0125752,0.0112098,-0.0106062,0.0042089,-0.000890621,-0.000916759,0.00186997,-0.00137941,-0.000920828
Malay,0.012521,-0.385901,-0.072105,-0.027907,0.122238,0.054216,-0.002961,-0.007246,-0.011126,-0.015672,0.058232,0.006624,-0.007255,0.002312,0.00722,0.001273,-0.005241,-0.000152,0.00269,0.002226,-0.009658,-0.004996,-0.00917,-0.002651,0.000742
Ma'anyan_(n=7),0.0100816,-0.417673,-0.0698211,-0.0441126,0.149171,0.0609176,-0.00480071,-0.013417,-0.013703,-0.0192911,0.076856,0.00875657,-0.009323,0.00202514,0.00756157,0.00242429,-0.00154614,0.00104957,0.00380686,0.00267986,-0.00809314,-0.0108283,-0.0104057,-0.00208286,-0.008947
Dusun,0.014607,-0.43143,-0.066436,-0.051196,0.147207,0.066794,-0.003368,-0.012153,-0.019702,-0.021717,0.074753,0.008542,-0.008053,-0.000482,0.012373,0.005989,-0.003129,0.004519,0.008422,-0.001209,-0.008818,-0.029161,-0.011626,-0.0049,-0.047201
Javanese_(n=29),0.0115393,-0.404426,-0.0798715,-0.034806,0.142191,0.0661644,-0.0043921,-0.0127078,-0.0110867,-0.0187327,0.0833837,0.00741059,-0.0101653,0.00700448,0.00563483,0.0027889,-0.000629414,-0.00128431,0.000385828,0.0114882,-0.0141991,0.00217028,-0.012992,0.00147083,0.0202913
Bajo_(n=2),0.004553,-0.395549,-0.088812,-0.005491,0.143411,-0.0023705,-0.0043475,-0.010384,-0.0177935,-0.017859,0.0561865,0.006519,-0.006095,-0.0019265,0.005836,0.0050385,-0.000652,0.0031035,0.0043995,-0.0040645,-0.008423,-0.015271,-0.0041905,-0.002892,-0.025626
Spanish_Galicia,0.108765,0.146462,0.041064,-0.001651,0.041204,-9.3e-05,-0.005457,0.002423,0.024713,0.030029,-0.002129,0.005737,-0.012611,-0.012157,0.011144,0.000589,-0.004237,-0.002161,-0.005042,-0.001007,0.000873,-0.002899,-0.000808,-0.003682,0.001304
Mapuche_Huilliche_Chile_(n=10),0.0554319,-0.304354,0.115889,0.0903431,-0.109036,-0.0187972,-0.28535,-0.345678,-0.0132533,-0.0142509,-0.0015751,-0.0016335,0.0021257,0.0223774,-0.0087267,0.0035269,0.0045113,0.0018497,0.0009051,0.0004752,-0.00141,0.0016198,-0.0043876,-0.0031931,-0.0036163
Karitiana,0.058809,-0.320061,0.118353,0.108367,-0.113662,-0.013619,-0.323061,-0.382484,-0.015373,-0.017343,0.000947,-0.002698,-0.001635,0.027318,-0.004569,0.00442,0.011017,0.002597,0.000105,-0.000354,-0.005532,0.010902,-0.005546,-0.00253,-0.006786
Piapoco,0.051505,-0.319892,0.120207,0.101099,-0.111482,-0.014502,-0.306748,-0.365177,-0.01038,-0.015855,-0.004425,0.001349,0.000557,0.024772,-0.004547,0.003945,0.007921,-0.003231,-0.000189,-0.001626,-0.002059,0.006275,-0.004129,-0.001657,-0.005808
References
- LAPITA Skoglund, P. et al. 2016. Genomic insights into the peopling of the Southwest Pacific. Nature 538, 510 to 513.
- VANUATU Lipson, M. et al. 2018. Population turnover in Remote Oceania shortly after initial settlement. Current Biology 28, 1157 to 1165.
- VANUATU Posth, C. et al. 2018. Language continuity despite population replacement in Remote Oceania. Nature Ecology and Evolution 2, 731 to 740.
- VANUATU Lipson, M. et al. 2020. Three phases of ancient migration shaped the ancestry of human populations in Vanuatu. Current Biology 30, 4846 to 4856.
- OCEANIA Feldman, M. et al. 2026. Ancient genomes reveal distinct human dispersals and social stratification in the settlement history of western Remote Oceania. Cell. Seventy-two ancient genomes from the eastern Solomon Islands, Vanuatu, Fiji and Tonga.
- OCEANIA Choin, J. et al. 2021. Genomic landscape of contemporary western Remote Oceanians. Genotype data for 1,433 ni-Vanuatu.
- MICRONESIA Liu, Y. C. et al. 2022. Ancient DNA reveals five streams of migration into Micronesia and matrilocality in early Pacific seafarers. Science 377, 72 to 79.
- MARIANAS Pugach, I. et al. 2021. Ancient DNA from Guam and the peopling of the Pacific. PNAS 118, e2022112118.
- NEAR OCEANIA Long-term isolation and archaic introgression shape functional genetic variation in Near Oceania. Science, 2026. One hundred and seventy-seven high coverage Near Oceanian genomes.
- RAPA NUI Ioannidis, A. G. et al. 2020. Native American gene flow into Polynesia predating Easter Island settlement. Nature 583, 572 to 577.
- RAPA NUI Moreno-Mayar, J. V. et al. 2024. Ancient Rapanui genomes reveal resilience and pre-European contact with the Americas. Nature 633, 389 to 397.
- RAPA NUI Fehren-Schmitz, L. et al. 2017. Genetic ancestry of Rapanui before and after European contact. Current Biology 27, 3209 to 3215.
- RAPA NUI Moreno-Mayar, J. V. et al. 2014. Genome-wide ancestry patterns in Rapanui suggest pre-European admixture with Native Americans. Current Biology 24, 2518 to 2525.
- BOTOCUDO Malaspinas, A. S. et al. 2014. Two ancient human genomes reveal Polynesian ancestry among the indigenous Botocudos of Brazil. Current Biology 24, R1035 to R1037.
- MADAGASCAR Brucato, N. et al. 2016. Malagasy genetic ancestry comes from an historical Malay trading post in southeast Borneo. Molecular Biology and Evolution 33, 2396 to 2400.
- MADAGASCAR Pierron, D. et al. 2017. Genomic landscape of human diversity across Madagascar. PNAS 114, E6498 to E6506.
- MADAGASCAR Pierron, D. et al. 2018. Strong selection during the last millennium for African ancestry in the admixed population of Madagascar. Nature Communications 9, 932.
- MADAGASCAR Kusuma, P. et al. 2016. Contrasting linguistic and genetic origins of the Asian source populations of Malagasy. Scientific Reports 6, 26066.
- DATA Global25 coordinates by Davidski, Eurogenes Blog. Population averages from the Moriopoulos 2026 collection. Mixture models checked against Vahaduo.