
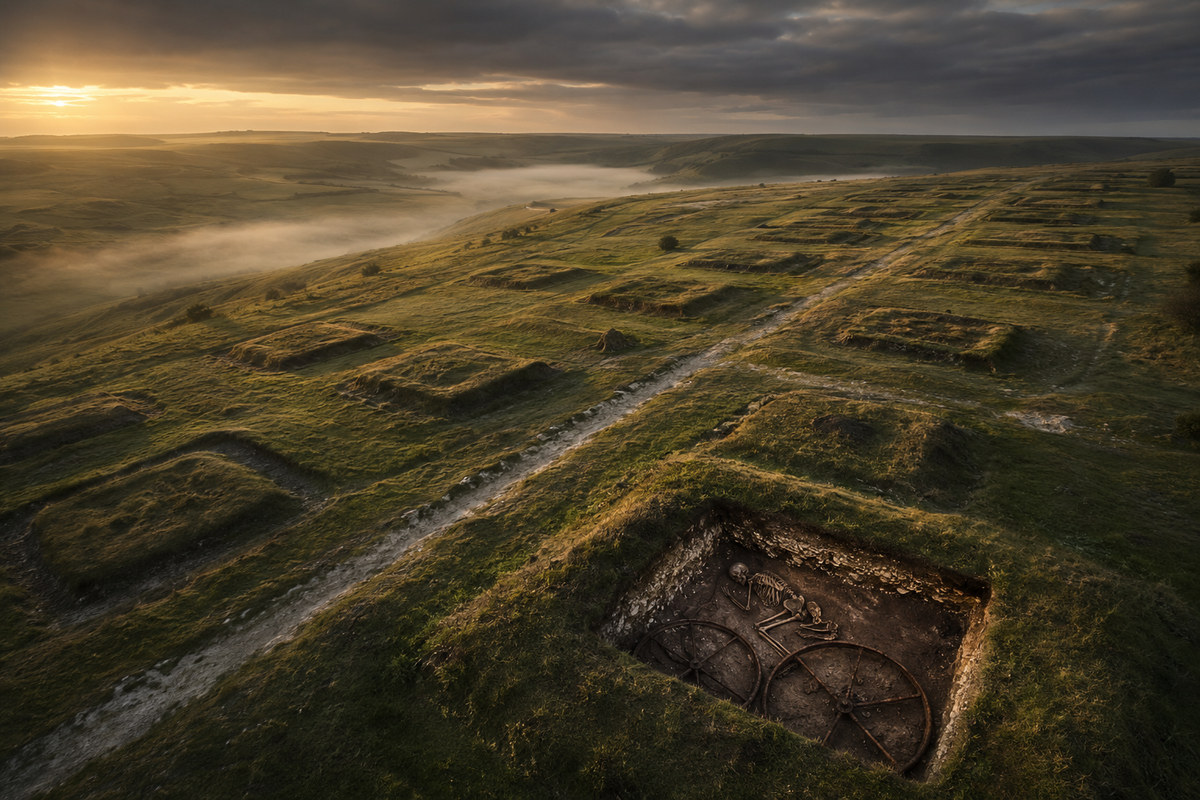
For two centuries the square barrows and dismantled chariots of the Yorkshire Wolds have been read as the calling card of an immigrant people, Gauls from the Marne who crossed the Channel and imposed a continental funerary rite on a corner of northern Britain. In August 2026 a team led by Inigo Olalde and Ian Armit published genome-wide data for 534 individuals from the Arras Culture, the largest ancient DNA dataset ever assembled for a single Iron Age tradition. The migration did not happen. What the graves contain instead is stranger and, in the end, far more interesting.
Eighteen seventeen, Arras Farm
In the summer of 1817 a group of East Yorkshire gentlemen opened a series of low mounds in a field near Market Weighton. It was the third season of digging at the site. What came out of the ground that year made the reputation of the place: a man laid out with a two-wheeled vehicle and two horses, a burial that entered the literature as the King's Barrow, and beside it the Queen's Barrow with its gold ring, its glass beads and its coral. The field was called Arras, a name that evolved locally from Erg through Herges and Erghus and has nothing whatever to do with the town of Arras in Pas-de-Calais, whose name descends from the Atrebates. The coincidence has nonetheless done a great deal of work in the imagination of British archaeology.
The cemetery gave its name to a whole archaeological culture. The Arras Culture occupies eastern Yorkshire, roughly the block of country bounded by the Humber estuary, the Ouse and the North York Moors, from the fifth to the first centuries BCE. It is defined almost entirely by how its people buried their dead: individual crouched inhumations under small square-ditched barrows, a rite that is close to invisible elsewhere in Britain during the same period, where human remains turn up mostly in pits and ditches on settlement sites rather than in formal cemeteries. Around thirty chariot burials are known from Britain and all but three of them are in eastern Yorkshire.
Everything about that description sounded continental to nineteenth and twentieth century eyes. Square barrows are a familiar feature of the Aisne-Marne region of northern France and the Belgian Ardennes. Vehicle burial is a La Tene rite. The decorated metalwork from the richest Yorkshire graves speaks fluent La Tene art. And when Ptolemy, writing in the second century CE, names the people of the region as the Parisi, the temptation becomes almost irresistible, because a Gaulish people called the Parisii lived on the Seine and gave their name to Paris.
Vere Gordon Childe concluded that the Arras people had invaded from the Marne. Christopher Hawkes folded them into his sequence of continental invasions of later prehistoric Britain. Ian Stead, who devoted his career to these cemeteries and whose 1991 volume remains the standard work, was sufficiently persuaded by the parallels to go and excavate in Champagne and the Ardennes himself. The Concise Oxford Dictionary of Archaeology still records that it is generally agreed the culture reflects an intrusive movement from across the Channel, with only the chronology and the exact source region in dispute.
The dataset that settles it
Olalde and colleagues sampled bone and teeth from 495 individuals from seven cemeteries in and around the Arras heartland. After in-solution enrichment for more than a million single nucleotide polymorphisms, 490 produced usable genome-wide data. Adding 44 individuals published earlier by Patterson and colleagues brings the final total to 534 individuals from ten cemeteries. The mean number of SNPs recovered from a core panel of 1.15 million autosomal targets is 964,521, and 526 of the 534 individuals clear 600,000 covered positions. By the standards of Iron Age archaeogenetics this is not a study, it is a census.
The bulk of it comes from Wetwang Slack, on the Wolds, which is the largest excavated Iron Age inhumation cemetery in Britain. Rescue work ahead of gravel quarrying in the 1970s and 1980s recovered 446 burials strung along a routeway through a densely farmed landscape, and 390 of those individuals are in the genetic dataset. Pocklington, at Burnby Lane, some eighteen kilometres to the southwest, contributes 100. Melton 1, next to the Humber about thirty kilometres to the south, contributes 28. Modelled radiocarbon dates place all three broadly in the fourth to second centuries cal BCE. Smaller numbers come from East Coast Pipeline, Burton Fleming, Nunburnholme, Melton 2, Wetwang Village, Ferry Fryston and Burstwick.
No recent continental ancestry, by three independent tests
The paper devotes a short and rather devastating section to the migration question. Three lines of evidence converge.
First, formal modelling. When the authors run qpAdm using Iron Age individuals from France as the sole ancestry source for the Arras population, the model fails, with a p-value below 0.001. It is not a marginal fit that could be rescued with a better reference set. It is a rejection.
Second, identity by descent. If a population has crossed the Channel within the last handful of centuries it leaves long shared haplotype segments behind with its relatives on the far side. There is no elevated IBD sharing between Arras Culture individuals and Iron Age France.
Third, the Y chromosome. The most common paternal lineage among Arras males is R1b-DF13, a lineage already at high frequency across Bronze Age Britain. At Wetwang Slack, where 149 males could be typed, undetermined DF13 accounts for 14.8 per cent, with R-Y485696 at 10.7 per cent, R-DF27 at 8.7 per cent, R-Z253 at 8.1 per cent and I2 at 8.1 per cent, and a long tail of further DF13 subclades. This is a British Bronze Age paternal profile, not a transplanted Gaulish one.
On top of that, ancestry is strikingly homogeneous. The authors modelled every individual as a mixture of Western Hunter-Gatherer, Early European Farmer and Steppe Early Bronze Age sources, and the resulting EEF proportions cluster tightly around 37 per cent with no meaningful difference between cemeteries and, importantly, no difference between burial types. The people in the primary barrow burials do not carry more continental ancestry than the people in the ditches and the flat graves. Whatever the chariot burials represent, it is not a foreign aristocracy sitting on top of a native peasantry.
The authors' conclusion is that the Arras funerary tradition reflects local British communities participating in wider La Tene-connected cultural networks, rather than the arrival of a continental population.
Checking it independently in Global25
A result this clean deserves an independent look. The Global25 dataset currently carries 46 unique East Yorkshire Iron Age genomes, dating from about 470 BCE to about 20 CE, which correspond to the previously published subset of the Arras material. The 490 newly sequenced individuals are not yet in G25 and will not be until the data are released. Everything below therefore rests on roughly nine per cent of the published sample, and is offered as corroboration rather than as a replication at scale.
The first question is simply which populations sit closest to the Arras average in 25-dimensional space.
The ordering is unambiguous. Non-Yorkshire English Middle Iron Age sits at 6.7, English Late Iron Age at 7.0, English Late Bronze Age at 9.4. The best continental candidate, the northwest European profile of La Tene Hauts-de-France, sits at 17.5, and the Grand Est samples, which are the closest thing G25 has to the Champagne region that Stead went digging in, sit at 20.9. Central European Hallstatt material is out at 45 and beyond.
Deep ancestry, and an agreeable coincidence
Running the standard three-source panel used across this site for European topics, with Yamnaya Samara, Anatolian Neolithic and Loschbour as poles, gives the following.
The Arras group returns 48.9 per cent Yamnaya, 37.6 per cent Anatolian Neolithic and 13.5 per cent Loschbour. That 37.6 per cent farmer figure is worth pausing on, because Olalde and colleagues, using qpAdm on a vastly larger sample with a completely different statistical machinery, report EEF proportions centred on roughly 37 per cent. Two methods that share almost nothing except the underlying biology land in the same place. It is a useful reminder that G25 NNLS, used carefully, is not merely decorative.
The comparison rows matter more than the Arras row. English Late Iron Age returns 48.9 / 37.6 / 13.4, which is the Arras profile to the first decimal. Non-Yorkshire English Middle Iron Age returns 47.4 / 38.5 / 14.1. The continental candidates go the other way: La Tene Hauts-de-France has less steppe and more farmer at 45.2 / 40.5 / 14.3, and Hallstatt Hauts-de-France more so again at 43.7 / 42.2 / 14.1. In other words the Arras population is not merely un-Gaulish, it is displaced from the Gaulish samples in the direction of having more steppe ancestry, not less.
The twist: the Arras people are less continental than the rest of England
This is where the analysis stops confirming the paper and starts adding to it.
Any attempt to quantify a small continental contribution here runs straight into a source degeneracy problem. English Late Bronze Age and La Tene Hauts-de-France are separated by only 20.3 units in G25 space, against the 338 to 495 units separating the poles of the deep panel. Feed two sources that similar into NNLS and the condition number climbs to 20.4. The split it returns is arithmetically valid and practically meaningless in absolute terms, because tiny perturbations of the target swing the answer wildly. This is exactly the trap that produces confident-sounding but worthless admixture percentages in amateur modelling.
The way around it is not to trust the split, but to hold the sources fixed and compare two targets. If the same degenerate model is applied identically to the Arras group and to contemporaneous non-Yorkshire Britons, the shared bias cancels and the difference between them remains informative.
| Target | Continental source | England LBA | Continental | Residual | Cond. |
|---|---|---|---|---|---|
| Arras / East Yorkshire IA | La Tene Hauts-de-France | 76.2% | 23.8% | 8.08 | 20.4 |
| Arras / East Yorkshire IA | Hallstatt Hauts-de-France | 77.7% | 22.3% | 7.64 | 16.7 |
| Arras / East Yorkshire IA | La Tene Grand Est | 86.4% | 13.6% | 8.94 | 18.9 |
| England MIA, non-Yorkshire | La Tene Hauts-de-France | 57.5% | 42.5% | 7.43 | 20.4 |
| England MIA, non-Yorkshire | Hallstatt Hauts-de-France | 62.4% | 37.6% | 6.59 | 16.7 |
| England MIA, non-Yorkshire | La Tene Grand Est | 68.0% | 32.0% | 8.99 | 18.9 |
Read the absolute percentages with the contempt they deserve. Read the contrast between the two blocks seriously. Under every continental source tested, the Arras group takes roughly half as much continental input as the rest of Middle Iron Age England. The culture that was supposed to be the immigrant one is the least continental group in the comparison.
A cleaner statistic
Rather than lean on collinear NNLS at all, the same question can be asked with a single projection. Take the vector running from the English Late Bronze Age average to the La Tene Hauts-de-France average, and score every population and every individual by where they fall along it, with the British pole at zero and the Gaulish pole at one hundred. This is one dimension instead of twenty-five, which throws information away, but it is numerically stable and it is exactly aligned with the question being asked.
The Arras group scores 23.8. Non-Yorkshire English Middle Iron Age scores 42.5, the Middle to Late Iron Age pooled group 54.3, English Early Iron Age 69.0, and the Durotriges of Dorset 42.0. Scotland, which is known to have escaped the relevant gene flow almost entirely, sits at minus 43.7 and English Chalcolithic to Early Bronze Age at minus 50.6.
Across 46 Arras individuals the mean is 23.8 with a standard deviation of 33.0, giving a standard error of 4.86. Across 148 non-Yorkshire English Middle Iron Age individuals the mean is 49.7 with a standard deviation of 42.9. A Welch test on the two distributions gives t equal to minus 4.30 and p equal to 4.0 times ten to the minus five. The Arras population is significantly less continental than its British contemporaries, and by a margin of nearly twenty-six points on a hundred-point scale.
Robustness and detection floor
A single axis defined by a single pair of poles is worth nothing on its own, so the test was repeated with four continental poles and two British poles, eight combinations in all. The sign never flips and the difference never loses significance. With English Late Bronze Age as the British pole the gap runs from minus 20.7 to minus 27.7 points, with p-values between 1.3 times ten to the minus five and 3.9 times ten to the minus four. With Chalcolithic to Early Bronze Age as the British pole the gap runs from minus 13.2 to minus 17.9, with p-values between 2.8 times ten to the minus five and 1.1 times ten to the minus four.
The detection floor matters as much as the result. Twice the standard error of the Arras mean is 9.7 points, so an additional continental contribution of under about ten per cent would not be visible in this sample. The claim being made is not that the Arras people received exactly zero continental gene flow. It is that they received no more than about ten per cent beyond what the rest of Iron Age Britain already carried, and that on the best point estimate they received measurably less.
For completeness, an NNLS spike-in test on the same source pair recovers nothing until roughly twenty per cent injected continental ancestry, which is precisely why the projection was preferred over the admixture split.
Why less, rather than the same
The apparent paradox dissolves once the Late Bronze Age is brought into the picture. Patterson and colleagues showed in 2022 that between 1000 and 875 BCE, ancestry from early European farmers increased sharply in southern Britain, England and Wales, but not in northern Britain, through the incorporation of migrants genetically closest to ancient individuals from France. Those migrants contributed roughly half the ancestry of Iron Age England and Wales, and they are the most plausible vector by which early Celtic languages reached the island.
East Yorkshire sits at the northern margin of that process. The Arras communities are less continental than Wessex or the Thames valley not because they resisted anything, but because the Late Bronze Age influx that reshaped the south reached the Wolds only weakly. The one genuine continental migration into Iron Age Britain arrived roughly five hundred years before the first square barrow was dug, and it arrived somewhere else.
The chronological transect adds a final nail. If a founding population had crossed the Channel around 400 BCE and been progressively absorbed, the earliest Arras individuals should sit high on the axis and the latest should sit low. If continental contact intensified through the La Tene period, the reverse. Across the Middle Iron Age at 23.3, the Middle to Late Iron Age at 25.1 and the Late Iron Age at 10.8, there is no trend that survives the sample sizes involved. The single early individual at 50.6 is one genome and carries no weight. The population is flat, and flat below the English average throughout.
So where did the chariots come from
They came from the same place that the potter's wheel, the safety-pin brooch and the Greek alphabet came from: a connected world in which prestigious ideas travel faster and further than the people who invented them.
The isotope evidence has been pointing this way for years. Multi-isotope work on seven chariot burials from Wetwang, Garton Station and Kirkburn found that the men and women in them were, with one exception, born and raised locally. The individual from Kirkburn probably spent his childhood elsewhere, but elsewhere is not the same as overseas. Later sulphur work at Pocklington suggested that around a third of individuals studied had moved between geological zones in their lifetimes, which describes an ordinarily mobile Iron Age society, not a colonising one.
It is also worth noticing how un-continental the Arras rite actually is once you stop looking at the headline. Continental La Tene chariot graves are typically extended inhumations in dispersed cemeteries with the vehicle intact. Arras burials are crouched, in cemeteries so crowded that barrow ditches cut one another, and the chariots are almost always dismantled before deposition. Pocklington Barrow 85, with its intact chariot and two ponies, is remarkable precisely because it breaks the local rule. This is not a rite imported wholesale. It is a local grammar that has borrowed a foreign vocabulary.
The Parisi and the Parisii, meanwhile, remain a coincidence of name that has been asked to carry an enormous amount of historical weight on the strength of nothing more than homophony. It is worth remembering that the name Arras itself, applied to the type site, is a Yorkshire field name with no French connection whatsoever. The Arras Culture has been twice misled by its own vocabulary.
What the genetics did find, which is more surprising than a migration
Having closed the migration question, the paper opens a much larger one. These cemeteries were organised around women.
At Wetwang Slack two mitochondrial haplogroups, T2e1a1b and H1ao, account for 51 per cent of the cemetery population. At Pocklington three haplogroups account for 70 per cent, at Melton 1 three account for 58 per cent, and the dominant lineages at the three sites do not overlap. The Y chromosome shows the opposite pattern: paternal lineages are diverse and the main ones occur at similar frequencies across all the cemeteries. Low, site-specific maternal diversity combined with high, regionally shared paternal diversity is very hard to reconcile with patrilocality and points firmly to matrilocality with male exogamy.
The scale of sampling at Wetwang Slack allowed the reconstruction of a pedigree of 195 individuals across thirteen generations, to the authors' knowledge the largest multi-generational pedigree yet built for any prehistoric population. It contains half of everyone with genome-wide data from the site, and it is biased toward women, 61 per cent female against 51.3 per cent among individuals outside it. Classifying reproductive unions by whether the female line or the male line already had relatives in earlier generations of the cemetery gives 84 matrilineal unions against 35 patrilineal and bilineal ones combined, with p equal to 8.2 times ten to the minus six. Where only one partner of a couple is buried at Wetwang Slack, it is the woman in 62 cases out of 75.
Certain women functioned as anchors for generations. Female I31517, who has 133 relatives at the site, was herself the child of closely related parents and was buried as a primary barrow inhumation in the centre of the cemetery. Thirty-seven of her descendants across nine generations were identified, many buried close to her, including a maternal-line great-great-great-grandson interred in the ditch of her own barrow more than a century after her death. Someone still knew where she was, and still knew that he belonged to her.
The alliance structure is more remarkable still. Of 45 unions where both maternal lineages could be assigned, 25 joined a T2e1a1b partner to an H1ao partner. Under random pairing the expected rate is 13.4 per cent; the observed rate is 55.6 per cent, a 4.1-fold excess with p equal to 3.2 times ten to the minus eleven. The direction was balanced, twelve unions with an H1ao male and thirteen with a T2e1a1b male. The two lineages were not equals, however. T2e1a1b runs for up to ten consecutive generations in one branch, nine in another, seven in a third, while H1ao rarely persists more than a generation or two, and H1ao individuals married into T2e1a1b in 89 per cent of cases. The authors compare the arrangement to exogamous matrilineal moiety systems documented ethnographically, such as those of the Tlingit and Haida of the Northwest Coast.
With one striking exception, nobody in these cemeteries reproduced with anyone carrying their own mitochondrial lineage. Given that the two main haplogroups are carried by 33 and 18 per cent of the site, that avoidance is not an accident. It implies detailed knowledge of maternal-line affiliation maintained across many generations and possibly hundreds of years.
The exception was buried with the chariots
Two hundred metres west of the main Wetwang Slack cemetery lies a small group of conjoined barrows containing three chariot burials, two male and one female. All three carry mitochondrial haplogroup H1ax, which is neither of the dominant site lineages. The woman, I36978, was the mother of one of the men and most probably the paternal grandmother and maternal great-aunt of the other, who descended from her union with a second man. Both male chariot burials had parents related at approximately the level of first cousins.
That level of parental relatedness is exceptional in this dataset. Among the non-chariot Arras individuals only 1 per cent, six out of 522, show anything comparable. Three of the four chariot burials elsewhere in the sample, at Wetwang Village, Ferry Fryston and Melton 1, are not endogamous at all. So the pattern is specific to this one lineage at this one site.
They were not isolates, though. A woman buried nearby with an elaborate coral-inlaid iron brooch was probably the paternal aunt of one of them. Another woman in the main cemetery, from the dominant T2e1a1b line, was most likely a paternal half-sister of I36978. And the richly furnished female chariot burial from Wetwang Village, a kilometre to the west, shares seven IBD segments totalling 128 centimorgans with I36978 while herself belonging to the H1ao lineage. The chariot group was a closed reproductive circle embedded inside an open kinship network.
There is a coherent story in that. In a society where affiliation, burial rights and presumably inheritance descended through the mother, a lineage that wanted to keep a claim concentrated could do so by marrying inward, exactly against the rule everyone else was following. Rank was maintained by breaking the norm that defined the community.
One further detail deserves mention because it connects to a Roman ethnographic claim usually dismissed as slander. Among individuals with more than one inferred reproductive partner, all twelve are genetically female. The authors note that this could reflect serial partnership in a high-mortality society, but also raise polyandry within a female-centred structure, and observe that at Wetwang Slack an unsampled woman had children by two men who were themselves close paternal relatives. Caesar wrote in the Gallic War that among the Britons groups of men, particularly brothers and fathers with their sons, shared wives. The pedigree does not prove him right. It does show that he was describing something structurally possible in this society rather than inventing a barbarian fantasy from nothing.
Who carries this ancestry now
The closest modern populations to the Arras average in Global25 are, in order, Bretons from Finistere at 12.4, Scots at 13.4, English at 13.7 and Orcadians at 13.9, with Irish and Welsh close behind. The Breton result is the kind of thing that gets over-interpreted, so it is worth being explicit: it does not mean the Arras people were Breton or that Bretons descend from them. It reflects the fact that Brittany received substantial British migration in late antiquity and has since experienced less of the continental gene flow that reshaped the rest of northern France, leaving it as a partial reservoir of an insular Atlantic profile.
For anyone with East Yorkshire ancestry, the honest answer is that the Arras population contributed to the modern English gene pool along with everyone else who lived in Britain before the Anglo-Saxon period, and that no commercial test can isolate that contribution. What can be said is that the people in these barrows were not newcomers. Their paternal lineages had been in Britain since the Beaker period.
Coordinates
The averages used in this article, for anyone who wants to reproduce or challenge the modelling. The Arras row is computed from the 46 unique East Yorkshire Iron Age individuals currently in Global25, dated between roughly 470 BCE and 20 CE. Paste into the source or target box in Vahaduo.
Arras_EastYorkshire_IA,0.129387,0.131401,0.059798,0.048717,0.037565,0.016000,0.002100,0.004876,0.005349,0.004873,-0.005031,0.006933,-0.015125,-0.017143,0.022078,0.008878,-0.003826,0.001256,0.000746,0.002384,0.005330,0.003863,-0.002470,0.007316,-0.000357
England_MIA_nonYorkshire,0.129639,0.135219,0.060287,0.047436,0.039760,0.016665,0.001738,0.004714,0.007244,0.005749,-0.005179,0.006706,-0.015236,-0.015644,0.021658,0.006169,-0.005291,0.001852,0.001460,0.003401,0.005968,0.004198,-0.001787,0.005754,-0.001405
England_LIA_nonYorkshire,0.128026,0.133079,0.060372,0.048422,0.037719,0.017303,0.003382,0.005739,0.004580,0.004279,-0.004406,0.005871,-0.014065,-0.015282,0.020860,0.008595,-0.000436,0.001245,0.002038,0.005551,0.003841,0.002355,-0.001634,0.007659,-0.001744
England_LBA,0.127672,0.131596,0.061251,0.053187,0.035878,0.017524,0.003075,0.005154,0.002420,0.001048,-0.005426,0.005770,-0.017728,-0.015632,0.023412,0.005668,-0.004325,0.002671,0.000325,0.003512,0.006177,0.003205,-0.000945,0.006176,-0.002135
England_EIA,0.127162,0.136113,0.061329,0.045018,0.040248,0.015322,0.002578,0.004594,0.008750,0.010012,-0.004161,0.005929,-0.016901,-0.012894,0.020383,0.002805,-0.008292,0.001825,0.001178,0.001231,0.006508,0.003524,-0.002738,0.002335,0.001512
England_CA_EBA,0.125277,0.126338,0.061824,0.061925,0.029900,0.021048,0.005699,0.003591,-0.000550,-0.006595,-0.003303,0.005409,-0.011387,-0.016562,0.025944,0.009385,-0.004930,0.002276,0.001147,0.006702,0.004940,0.002500,-0.000235,0.005449,-0.000535
England_LIA_Durotriges,0.131150,0.135065,0.059627,0.045112,0.040110,0.016734,0.002820,0.006871,0.007726,0.008970,-0.007001,0.006611,-0.016022,-0.019649,0.021022,0.017075,0.005490,0.000239,-0.000112,0.006295,0.007473,0.001649,-0.000438,0.006560,-0.000559
Scotland_MIA_LIA,0.131710,0.129407,0.061471,0.060263,0.032314,0.017849,0.005271,0.007088,0.000555,-0.002551,-0.005730,0.007836,-0.013804,-0.014745,0.026233,0.007652,-0.005643,0.001955,-0.002316,0.005056,0.004956,-0.001237,-0.001285,0.008297,0.000804
France_LaTene_HautsDeFrance,0.126913,0.136716,0.062696,0.043040,0.038392,0.013980,0.000382,0.003461,0.007849,0.008292,-0.001259,0.003110,-0.014086,-0.012765,0.014301,0.005453,-0.005509,0.004672,0.001226,0.003439,0.006005,0.003772,-0.000293,0.000828,-0.004625
France_Hallstatt_HautsDeFrance,0.125661,0.138315,0.059698,0.040310,0.040900,0.013694,0.001339,0.006461,0.009879,0.010570,-0.006285,0.004991,-0.014301,-0.008932,0.013029,0.003593,-0.003351,0.000950,0.001395,0.003664,0.003170,0.002523,-0.000998,0.002012,-0.000898
France_LaTene_GrandEst,0.127970,0.133905,0.062117,0.046189,0.040931,0.010996,0.004532,0.005307,0.006019,0.007420,-0.002157,0.006765,-0.011681,-0.009319,0.015782,-0.003656,-0.009537,0.002588,0.002532,0.003555,0.005169,0.001837,0.000088,0.000878,-0.000017
Yamnaya_Samara,0.125838,0.089254,0.042908,0.115456,-0.027868,0.044685,0.004491,-0.002949,-0.054858,-0.072996,0.001858,0.000350,-0.001652,-0.023610,0.037263,0.015734,0.000000,-0.001478,-0.001704,0.012506,-0.003120,0.001374,0.011229,0.018436,-0.004524
Anatolia_Neolithic,0.117902,0.180087,0.003426,-0.101059,0.051240,-0.047969,-0.003799,-0.006846,0.036167,0.080678,0.008261,0.011309,-0.024164,0.000579,-0.042712,-0.010370,0.022556,0.001388,0.013649,-0.010448,-0.014261,0.005693,-0.004904,-0.003750,-0.004436
Loschbour_WHG,0.130897,0.109677,0.203645,0.198000,0.162492,0.059125,0.015041,0.038075,0.100217,0.016219,-0.015427,-0.017235,0.019921,-0.001239,0.061346,0.070670,0.002608,0.007348,-0.008925,0.065406,0.117543,0.010387,-0.049422,-0.173639,0.019519
Methods and caveats
How the G25 analysis was done
Coordinate files were merged in priority order, population averages first, then modern averages, then the Moriopoulos 2026 all-averages no-simulations collection, with dated individual ancient samples added without overriding existing keys. The Arras average was built from individual-level coordinates for all East Yorkshire Iron Age genomes, deduplicated by sample identifier, keeping the highest-coverage version where a sample appears in more than one file, and excluding the single Anglian individual. Three known close relatives were retained; removing them shifts the average by 1.1 units per thousand, which is negligible.
All admixture proportions come from non-negative least squares with a sum-to-one constraint imposed as an additional row weighted at 1000. Condition numbers and pairwise pole separations are reported for every model rather than only the ones where they look good. Distances are Euclidean over all 25 dimensions, multiplied by 1000 to match the convention used elsewhere on this site.
The main caveats are worth stating plainly. First, 46 individuals out of 534 is a small slice, and the analysis will be worth redoing when the full dataset reaches Global25. Second, individual ancient coordinates from enriched 1240k-style data are noisy, which is why the individual scatter is so wide and why the group-level tests carry the argument rather than any single genome. Third, the continentality axis is a one-dimensional projection and deliberately discards information; it was chosen because the two-source NNLS alternative is degenerate at these pole separations, and both are reported so readers can see the difference. Fourth, all of this corroborates a published qpAdm result rather than establishing one, and where the two disagree the qpAdm figures should be preferred.
A note on the preprint
The Olalde et al. study was posted to bioRxiv on 6 August 2026 and has not been peer reviewed. Its central results rest on very large sample sizes and standard methods, and the migration conclusion in particular is supported by three independent lines of evidence, so it is unlikely to be overturned. Details of the pedigree reconstruction, which necessarily involves inference about unsampled individuals, may well change between preprint and publication.
Sources
- Olalde, I., Armit, I., Buster, L., Lillie, M., Urkixo F. de Zuazo, E. et al. 2026. Ancient DNA reveals matrilineal organisation and recurrent unions between dominant matrilines in Iron Age Britain. bioRxiv 2026.08.03.742615.
- Patterson, N., Isakov, M., Booth, T. et al. 2022. Large-scale migration into Britain during the Middle to Late Bronze Age. Nature 601, 588-594.
- Cassidy, L. M., Russell, M., Smith, M. et al. 2025. Continental influx and pervasive matrilocality in Iron Age Britain. Nature 637, 1136-1142.
- Stead, I. M. 1991. Iron Age Cemeteries in East Yorkshire. English Heritage Archaeological Report 22.
- Stead, I. M. 1965. The La Tene Cultures of Eastern Yorkshire. Yorkshire Philosophical Society.
- Giles, M. 2012. A Forged Glamour: Landscape, Identity and Material Culture in the Iron Age. Windgather Press.
- Halkon, P. 2013. The Parisi: Britons and Romans in Eastern Yorkshire. History Press.
- Jay, M., Haselgrove, C., Hamilton, D., Hill, J. D. and Dent, J. 2012. Chariots and context: new radiocarbon dates from Wetwang and the chronology of Iron Age burials and brooches in East Yorkshire. Oxford Journal of Archaeology 31, 161-189.
- Dent, J. 1985. Three cart burials from Wetwang, Yorkshire. Antiquity 59, 85-92.
- Stephens, M. 2023. Chariots, Swords and Spears: Iron Age Burials at the Foot of the East Yorkshire Wolds. Oxbow Books.
- Gretzinger, J. et al. 2024. Evidence for dynastic succession among early Celtic elites in Central Europe. Nature Human Behaviour 8, 1467-1480.
- Secher, B. 2026. L'ADN ancien dans une population celte de la culture d'Arras en Angleterre suggere une organisation sociale matrilineaire. Genealogie genetique blog, 11 August 2026, secher.bernard.free.fr. A French-language summary of the Olalde et al. preprint.
Global25 coordinates by Davidski (Eurogenes). Population averages from the Moriopoulos Collection 2026. Modelling performed with Vahaduo-compatible coordinates and verified independently in Python. Charts generated programmatically for ExploreYourDNA.