
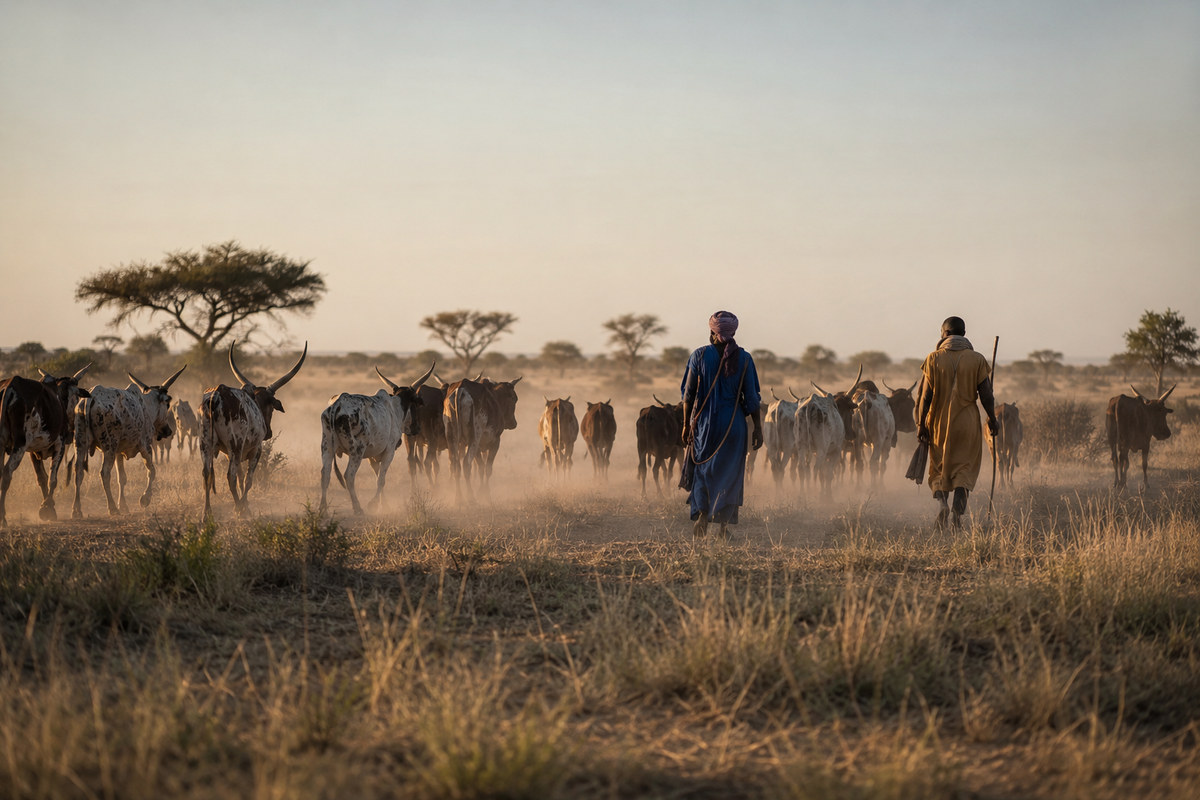
Somewhere between twenty-five and forty million people call themselves Fulani, Fulbe, Peul or Haalpulaar, and they are spread in ribbons and pockets from the Atlantic coast of Senegal to the shores of Lake Chad, speaking one language and, for a large minority of them, still herding cattle across other people's farmland. They have been the subject of more speculative origin stories than any other African population: Egyptian, Berber, Syrian, Indian, Jewish, each proposed by someone who noticed that some Fulani do not look like their neighbours. The modern genetic literature has replaced all of that with a single, careful, and much less romantic finding, which is that the Fulani carry a real and substantial slice of non-African ancestry that arrived through North Africa. This article does three things with a Global25 calculator and eight sampled Fulani populations. It measures how much of that ancestry there is, which turns out to be anything between one and thirty-nine per cent depending on which Fulani you ask. It asks what the line separating those Fulani from each other actually is, and the answer is not a map. And it tests which North African population the signal points at, which is a question the calculator can partly answer and partly cannot, and the difference between the two halves is the methodological point of the whole exercise.
A people with no homeland and too many origin stories
The Fulani are the largest pastoral population on earth and one of the very few large populations without a territory. Fulfulde and Pulaar are the same language under two names, and it belongs to the Senegambian branch of Niger-Congo, alongside Wolof and Serer, which places its linguistic origin firmly in the far west of the Sahel and not in Egypt or Arabia. The historical record, such as it is, starts in Futa Toro on the middle Senegal river, moves south to Futa Jallon in the Guinean highlands, and then runs east across the whole of the Sahel over roughly the last fifteen hundred years, reaching the Chad basin by the fifteenth century and northern Cameroon later still.
What complicates this is that Fulani expansion was never only demographic. It was also a process of absorption. Sedentary communities were incorporated into Fulani identity, in Cameroon and elsewhere, through a process that ethnographers call Fulanisation, and the theocratic states founded in the eighteenth and nineteenth centuries, Massina, Sokoto, Futa Toro, converted large settled populations into Fulani subjects and eventually into Fulani. At the same time other Fulani groups stayed fully nomadic and endogamous, and some still are. A single ethnonym therefore covers a spectrum running from a herding lineage that has married inside itself for a very long time to a farming village that became Fulani three centuries ago.
Everything in this article follows from that fact, and the numbers below make it visible with an unusual clarity.
The origin theories are worth one paragraph because they explain why the question feels loaded. Colonial ethnography, working from the Hamitic hypothesis and from the observation that some Fulani have narrower features and lighter skin than surrounding populations, proposed a Near Eastern or North African ancestral homeland and treated the pastoralism as an import. Later writers, notably Amadou Hampate Ba, drew a different line, connecting Fulani pastoral symbolism to the cattle paintings of the Tassili n'Ajjer in the central Sahara. Those two traditions are not the same claim. One says the Fulani are foreigners; the other says they are the survivors of the Sahara. The genetic data speaks to the second more usefully than to the first, and the section on the Green Sahara below explains where a coordinate calculator has to stop.
What the uniparental markers and one gene already said
Three independent lines of evidence pointed at North Africa before any autosomal model was built, and they frame everything below.
The first is mitochondrial. Sahelian nomadic pastoralists carry West Eurasian mitochondrial lineages at rates that sedentary farmers in the same region do not, and among the Fulani those lineages are specific: subclades of U5b1b and H1, the same haplogroups that are common in the Maghreb and in southwestern Europe, and which in the Fulani have differentiated into their own private branches, U5b1b1b and H1cb1. Private branches mean time. These are not lineages that arrived last century.
The second is paternal. The Y chromosome pool of the Fulani is largely African, dominated by branches of haplogroup E, but it includes R1b-V88, a lineage which is essentially absent from West Africa outside the Sahel, reaches high frequencies among Chadic-speaking populations of northern Cameroon and Chad, and has a phylogeny that points at a trans-Saharan crossing rather than a coastal one. Its reported frequency in Fulani samples varies enormously by region, which is a recurring theme.
The third is a single base pair. The lactase persistence allele at position minus thirteen thousand nine hundred and ten, the variant that lets most northern Europeans digest milk as adults, is present in western Sahelian Fulani at frequencies reported between eighteen and sixty per cent, and it is virtually absent from the sedentary farmers around them. Vicente and colleagues in 2019 showed that the allele in Fulani individuals sits on a European haplotype background, which rules out convergent evolution and requires gene flow. Priehodova and colleagues in 2020 found the same variant confined, in the western Sahel, to pastoralists: Fulani, Tuareg, Moors. A two-megabase stretch of chromosome two, shared between Fulani herders in Burkina Faso and populations in Europe and North Africa, is about as direct a statement of admixture as human genetics produces.
As in every article in this series, the awkwardness has to be flagged before the models start. A Global25 coordinate is an autosomal summary, inherited equally from both parents, and it carries no label saying which side anything came from and no label saying when. Everything below is silent on the sex bias the uniparental data is pointing at, and silent on dates.
Data and method
Everything below uses Global25 scaled coordinates, with population averages merged from Davidski's published files and the Moriopoulos 2026 collection. Ancestry proportions come from non-negative least squares with a sum-to-one constraint imposed by appending a heavily weighted row of ones, with the resulting weights normalised. Distances are scaled Euclidean distances multiplied by one thousand, the convention used throughout this site.
Eight Fulani population averages are available, totalling 281 individuals: two from Gambia, two from Guinea, two from Burkina Faso, one from Senegal and one from Cameroon. Where the source collection found internal structure it split a country's sample into two clusters, labelled A and B. That split turns out to be the single most important fact in the dataset, and it gets its own section.
Pooling all 281 individuals produces an average that no sampled Fulani group is close to, because the underlying distribution is not one cloud but two. This article therefore works with two targets. The pastoralist pool is a weighted average of the four samples on the high side of the split, 134 individuals from Gambia, Guinea, Burkina Faso and Cameroon. The western pool is the other 147, from Gambia, Guinea, Senegal and Burkina Faso. They sit 143.0 units apart. Where a single figure is quoted for "the Fulani" without qualification it refers to the pastoralist pool, and the all-in pooled average is reported alongside it.
Fifty-two individually genotyped Fulani are also available, twenty-five from Guinea, twenty-five from Ziniare in Burkina Faso and two from Cameroon, and they are used for the individual-level section.
One panel does the work in every decomposition below, so that rows are directly comparable: the Mandinka of Gambia as the West African pole, the Iberomaurusian genomes from Taforalt in Morocco as the deep North African pole, and the Anatolian Neolithic of Barcin as the farmer pole. Its condition number is 2.99 and its three pole separations are 533, 758 and 463 units, all far above the hundred-unit threshold below which we treat two-source separation as unreliable on this site. The Barcin average is the identical one used in our articles on the Corded Ware, on Iron Age Britain and on haplogroup I1, so the farmer column here is on the same scale as the farmer column there.
Two honest notes before any number is used. The Cameroon sample is two individuals and is reported because it is the eastern extreme, not because two people are a population. And there is no ancient DNA from the Sahel at all. Every ancient population in this article is either North African or Central African, and the entire history of the region between them is being reconstructed from living people, which is a much weaker position than any of the European articles on this site.
Where the Sahelian Fulani sit
The simplest measurement sets up everything else, and it produces the strangest chart this site has published.
Every population within reach of the pooled Sahelian Fulani average, ranked by Global25 distance. The two nearest non-Fulani populations arrived at that position by two unrelated routes, and neither is a clue.
Four things on that chart.
The first is at the top and it is the article's spine. The pastoralist samples from Gambia, Burkina Faso and Guinea sit 5.6, 9.1 and 17.2 units from their own pooled average. Gambia and Burkina Faso are roughly two thousand kilometres apart, with Senegal, Mali and half the Sahel between them, and the two samples sit fifteen units from each other. That is closer than two samples of Danes.
The second is what is missing from the top. The other Gambian sample, ninety-nine people from the same small country, sits 161.4 units away, which puts it in among the West African farming populations: further from the Sahelian Fulani than the Hausa or the Soninke are, and about level with the Wolof and the Mandinka of its own country. Two groups of people who call themselves Fulani, who live in the same small country and speak the same language, sit 156 units apart from each other, which is four times the distance from a Gambian Mandinka to a Nigerian Yoruba.
The third is the identity of the nearest non-Fulani neighbours, and it is a warning rather than a finding. The closest population on earth to the Sahelian Fulani, excluding other Fulani, is a four-person outlier group of Haratin from the Gourara oases at Timimoun in the Algerian Sahara, at 55.6 units. The second closest is a sample of 115 African-Americans, at 78.7. Neither of those is a clue about Fulani origins. The Haratin of the Algerian oases are the descendants of sub-Saharan people who ended up in the Maghreb; African-Americans are West Africans mixed with Europeans over four centuries. Both arrive at roughly the Fulani position on the first axis of the coordinate space by combining an African base with a Eurasian-shifted component, and a Euclidean distance cannot tell you that they got there by three completely unrelated routes. This is the single most important caution in the article and it is why nothing below rests on a nearest-neighbour ranking.
The fourth is the bottom of the chart. Every actual North African population sits a very long way away: the Tuareg Berbers of Mali at 322, the Iberomaurusian hunter-gatherers of Taforalt at 378, the Shilha Berbers of Morocco at 409. Whatever the Fulani are, they are not a North African population that moved south. They are a West African population carrying a minority component, and the rest of this article is about measuring it.
The line is social, not geographic
The bimodality deserves its own numbers, because it is the finding that reorganises everything else.
Take the six samples that come in pairs. The two Gambian samples sit 156 units apart. The two Guinean samples sit 118 apart. The two Burkinabe samples sit 57 apart. Now take the samples across countries. The Gambian and Burkinabe pastoralist samples sit 15 units apart. The Gambian and Guinean pastoralist samples sit 13 apart. The Gambian and Guinean samples on the other side of the split sit 28 apart.
So a Fulani in Gambia is genetically ten times further from another Fulani in Gambia than he is from a Fulani two thousand kilometres east, provided both are on the same side of the split. Distance along the Sahel explains a small amount. Whatever the split is, it explains almost everything.
What the split is cannot be read off the coordinates, but the ethnography names it. The Fulani expansion absorbed settled populations wholesale, and the resulting communities kept the language and the identity while their gene pool converged on their neighbours. The other tradition, the endogamous herding lineages, did not converge. The one sample in this dataset with a recorded lifestyle label, the Fulani of Ziniare in Burkina Faso, is a pastoralist community, and it sits on the high side. The Gambian sample that sits 11 units from the Mandinka of Gambia is, in coordinate terms, Mandinka.
That is not a statement about who is really Fulani, a question genetics has no standing to answer. It is a statement that "Fulani" names a social category that has been recruiting for a thousand years, and that a population average computed over such a category is an average over the recruitment, not over a people.
The decomposition
Breaking the same populations into components gives the shape of each gene pool.
The identical three-source panel applied to the eight Fulani samples, to the Berbers of the Sahara and the Maghreb, and to the ancient populations of Morocco.
The pastoralist pool comes out at 71.8 per cent West African, 15.3 per cent Iberomaurusian and 12.9 per cent Anatolian Neolithic farmer, with a fit of 10.7 units. The non-African total is therefore 28.2 per cent, and the eight samples run from 1.3 per cent in the Gambian A sample to 39.2 in Cameroon. The all-in pooled average of 281 individuals returns 15.6 per cent, which sits comfortably beside the figure of roughly twenty per cent that the published literature has been reporting from genome-wide data since the mid 2010s.
Three things make that total trustworthy. It is stable under substitution of the West African pole: swapping the Mandinka for the Wolof, Serer, Jola, Bambara, Mossi, Mende, Esan or Yoruba moves the pastoralist figure between 27.5 and 33.7 per cent. It is stable under substitution of the deep North African pole: Taforalt, the Moroccan Early Neolithic of Ifri n'Amr ou Moussa, the Epipalaeolithic of Ifri Ouberrid and the Algerian Iberomaurusian of Afalou all give between 28.4 and 29.5. And it is stable under substitution of the farmer pole: Barcin, Boncuklu, Sardinians and the Moroccan Late Neolithic all give between 28.2 and 29.7.
The farmer column is also genuine rather than fitted noise. Modelling the Burkinabe pastoralist sample as Mandinka alone gives a fit of 178.1 units and an r-squared of nothing in particular. Adding the Taforalt pole takes the fit to 62.4 and the r-squared to 0.9809. Adding the Barcin pole takes the fit to 13.4 and the r-squared to 0.9991. A source that was merely soaking up noise would not do that. Adding a fourth source of any kind takes the fit no lower than 12.1.
Now read the bottom half of the chart, because that is where the interesting question is. Within the non-African portion of each row, the ratio of Iberomaurusian to Anatolian farmer is not constant across North Africa. The Moroccan Early Neolithic of Ifri n'Amr ou Moussa is 97 per cent Iberomaurusian, because the farmers had not arrived yet. Kelif el Boroud a thousand years later is 31 per cent. Modern Riffian and Kabyle Berbers are 35 and 33 per cent. Moroccan Shilha are 48. The Tuareg Berbers of Mali, the only Saharan Berbers in the panel, are 53.
The Fulani are 54.3 per cent, and every one of the four pastoralist samples returns between 54.0 and 55.5.
That number is worth pausing on. It says the North African source of the Fulani carried substantially more Iberomaurusian ancestry, relative to Neolithic farmer ancestry, than any Berber population of the Mediterranean coast does today, and about the same amount as the Berbers of the Malian Sahara. It also says the source carried a real farmer component, which the pre-Neolithic populations of the Maghreb did not have. Under substitution of the West African pole that share moves between 52.3 and 59.6; under substitution of the farmer pole between pure farmer sources it moves between 54.0 and 55.3.
Which North Africa
The three-source model says what the source was made of. A different procedure asks which known population it most resembles, by modelling the Sahelian Fulani as Mandinka plus exactly one other source and ranking the candidates by how well they fit.
Fifteen candidate second sources added to a Mandinka baseline. Every Berber population beats every non-Berber population, and the Maghrebi sources that predate farmer ancestry come last.
The ordering is unambiguous and it is not the ordering the popular accounts imply. Every Berber population beats every non-Berber population. The Tuareg of Mali fit at 7.9 units taking 35 per cent of the weight, the Shilha of Morocco at 11.4 taking 29 per cent, the Zenati of Tunisia, the Mozabites of Algeria and the medieval Guanches of the Canary Islands between 19 and 20. The Moroccan Late Neolithic of Kelif el Boroud follows at 27.6.
Then a gap, and then everything else. The Natufians of Israel fit at 40.9. The Copts of Egypt at 42.2. Saudis at 49.7, Sardinians at 50.3, the Anatolian Neolithic at 50.3. And at the bottom, worse than the Levant and worse than Europe, the two Maghrebi sources that predate the arrival of farmer ancestry: Ifri n'Amr ou Moussa, Neolithic in its pottery but ninety-seven per cent Iberomaurusian in its genome, at 56.2, and the Iberomaurusians of Taforalt themselves at 59.8.
Read that last pair carefully, because it is the load-bearing result. Taforalt is the population that supplies the deep North African component in the three-source model, where it takes 15.3 per cent of the weight and the model cannot do without it. But Taforalt on its own is one of the worst available proxies for the Fulani's second parent. The source has to be North African and it has to carry farmer ancestry. Neither half of that is optional, and the only populations that satisfy both are Berbers and the post-Neolithic Maghreb.
That has a chronological consequence, stated carefully. Anatolian-derived farmer ancestry arrives in the Maghreb around the middle of the sixth millennium BC, at Kaf Taht el-Ghar, and by Kelif el Boroud around 3000 BC it is the majority component of northern Morocco. A source population carrying that ancestry cannot predate its arrival. This does not date the admixture into the Fulani, which could be at any point afterwards, and the calculator has no way to say. It sets a floor under the source, not under the event.
One number in fifteen disguises
Before that ranking is trusted, it has to survive the test that killed the equivalent analysis in our article on Iron Age Britain.
In that article, every candidate second source for the Durotriges delivered almost exactly the same increment of farmer ancestry, and the model was revealed to be solving a single scalar equation in which the identity of the source was invisible. The same test applies here. Multiply each candidate's fitted weight by the amount of non-African ancestry it carries in its own right, and see whether the products differ.
The same candidates, scored on how much non-African ancestry each one delivers rather than on how well it fits. On this measure they are indistinguishable.
They do not. The target requires 28.2 points of non-African ancestry, and the fifteen candidates deliver between 21.4 and 29.9. A source that is one third non-African takes seventy per cent of the weight; a source that is entirely non-African takes twenty-two. This is exactly the same degeneracy, and it means that no candidate on that list can be excluded on the grounds that it fails to deliver the right amount. The amount is not information.
The difference from the British case is that the fits are not degenerate. There, the seven candidates fitted between 11.5 and 12.1 units, a spread of five per cent, and the model could not choose. Here the fifteen candidates fit between 7.9 and 79.4, a spread of a factor of ten, and it can. The reason is geometric. In Britain, the two poles being compared sat forty units apart, well under our threshold, so they were the same point for practical purposes and the residual carried no information. Here the poles sit between 463 and 758 units apart. The scalar is degenerate; the shape is not.
The general lesson is worth extracting, because it applies to every model anyone builds in Vahaduo. A weight is not evidence. Two sources that produce identical weights can produce very different residuals, and the residual is where the identification lives. If a model reports that your target is thirty-five per cent something, the useful question is never whether thirty-five is plausible. It is whether swapping that source for a different one at the same distance changes the fit.
The Green Sahara, and why this calculator cannot vote on it
Which brings us to the most attractive hypothesis in the field, and to a place where the honest answer is that the instrument is not good enough.
The Sahara was green between roughly 12500 and 3000 BC, cattle were being herded and milked in the central Sahara by around 5500 BC, and the obvious story is that the Fulani are what became of those herders when the lakes dried and the pastoralists moved south into the Sahel. Fortes-Lima and colleagues in 2025, working with 460 Fulani across eighteen local populations, reported a genetic component shared by every Fulani group that they interpreted as a plausible signature of exactly that: the beginning of African pastoralism in the Green Sahara. They also found an Iberomaurusian-associated component in every Fulani group, running between 9.1 and 28.3 per cent, which is the same component this article recovers as the Taforalt column.
In 2025 the Green Sahara itself was sequenced. Salem and colleagues published two roughly seven-thousand-year-old Pastoral Neolithic women from the Takarkori rock shelter in southwestern Libya and found something nobody predicted: their ancestry comes overwhelmingly from a North African lineage that split from sub-Saharan populations at about the same time as the out-of-Africa migration and then stayed isolated for tens of thousands of years. Takarkori and the Iberomaurusians of Taforalt are, on their measurements, equally distant from sub-Saharan lineages. The Green Sahara was not a corridor. It was a barrier with grass on it.
Global25 has a coordinate for one of those individuals, and the temptation to plug it in as a source is obvious. This article did, and then threw the result away, and the reason is worth setting out because a lot of people are going to make this mistake.
In the coordinate space, Takarkori sits 247 units from the Yoruba. Taforalt sits 564 units from the Yoruba. The coordinates therefore place the Green Saharan woman more than twice as close to West Africans as they place the Iberomaurusians, while the published f-statistics say the two are equally distant from sub-Saharan lineages. That discrepancy is not a small calibration issue. It happens because a set of twenty-five principal components computed on living populations can only describe a sample along the axes that other people's ancestry defines. A lineage with a long private branch and no close modern relatives has nowhere to go except toward the middle, and it lands wherever the axes happen to send it.
The consequences are visible in every model. Takarkori fits worst of the fifteen candidates, at 79.4 units, and takes an absurd 70.5 per cent of the weight while doing so, because the model is using it as a diluted West African rather than as a North African. Adding it as a fourth source to the main panel changes the fit from 13.4 to 12.1, which is nothing.
So: this article makes no claim about the Green Sahara. The finding that the Fulani's North African source carried Neolithic farmer ancestry is a real constraint and it points away from a purely pre-agricultural Saharan source, but the constraint is on the source population's composition, not on when the Fulani acquired it, and the one directly relevant ancient genome cannot be used. Anyone who tells you that a Vahaduo run has settled the Green Sahara question is telling you about their model, not about the Sahara.
Every individual, one dot each
Group averages hide people, and in this dataset they hide a great deal.
Fifty-two individually genotyped Fulani, plotted by the non-African weight the identical model assigns them.
The fifty-two individually genotyped Fulani run from 0.0 to 40.6 per cent non-African ancestry. Five of the twenty-five Guineans return literally nothing, and are indistinguishable from their Mandinka and Wolof neighbours. The median Guinean returns 13.7 per cent. The median Fulani of Ziniare, from a pastoralist community in Burkina Faso, returns 29.2, and the lowest Ziniare individual returns 18.5, which is above the Guinean median. The two Cameroonians sit at 38.3 and 40.0.
The overlap between the Guinean and Burkinabe distributions is small but real: three Guineans sit inside the Burkinabe range. The median Guinean individual sits 69.5 units from the Guinean mean and the median Ziniare individual 39.1 units from theirs, against 113 units between the two group means. The within-group scatter is more than half the between-group distance, which is the ordinary situation in admixed populations and the reason why an individual's result cannot be predicted from their community's average.
This matters for anyone running their own coordinates. A Fulani customer who gets back four per cent North African and a Fulani customer who gets back thirty-five are both getting correct answers about themselves, and neither is getting an answer about the Fulani.
What is not there
Three negative results, each with a measured detection floor behind it, because a zero is only worth reporting if you can show the model would have found the thing.
The floor was established by spiking synthetic targets. Adding a known fraction of Moroccan Shilha Berber ancestry to the Mandinka average and pushing the result through the three-source panel recovers 0.47 per cent from a true 0.5, 0.94 from a true 1.0, and 1.87 from a true 2.0. The model sees half a per cent.
The first negative is Arabian. Adding a Saudi, Bedouin or Yemenite source as a fourth pole to the Burkinabe pastoralist sample returns between 1.7 and 2.3 per cent, and moves the fit from 13.4 to 13.0. Against a demonstrated floor of half a per cent, a weight of two per cent that buys no improvement in fit is model noise, not ancestry. Given that the Fulani have been Muslim for centuries and that the Sahel has had Arab contact throughout, this is a real finding rather than an absence of data. The Arabian pastoralist expansion that carried a different lactase persistence variant into the eastern Sahel around the beginning of the second millennium does not show up in the western Fulani autosomes at all.
The second negative is European in the direct sense. A Sardinian fourth source takes 5.1 per cent and improves the fit from 13.4 to 12.8, which is the largest of the fourth-source weights and still not enough to be worth reporting as a component. The European-looking part of the Fulani signal, including the lactase persistence haplotype, arrives via North Africa, where that ancestry has been present since the Neolithic, rather than directly.
The third negative is eastern. Dinka, Nuer, Somali, the Mota genome from Ethiopia and the Beja of Sudan all take between 1.1 and 2.0 per cent as fourth sources and none of them improves the fit by more than three per cent. Modelled the other way round, with a Nilotic base instead of a West African one, the Fulani fit catastrophically. Whatever route the Fulani ancestors took, the calculator sees no Nile in it.
The other Saharan pastoralists
One contrast is worth drawing, because it shows that "North African ancestry in a Sahelian herding population" is not one phenomenon.
The Toubou of Chad, Daza and Teda, are Saharan pastoralists occupying the Tibesti and the desert south of it. They carry a large non-African component, and under the Fulani panel they fit at 126.3 units, which is a failure. Replace the West African pole with the Dinka and the fit drops to 29.0, returning 69.1 per cent Nilotic, 20.2 per cent Iberomaurusian and 10.6 per cent Anatolian farmer.
Two Saharan pastoralist populations, two thousand kilometres apart, both with roughly thirty per cent North African ancestry, and completely different African substrates: West African for the Fulani, Nilotic for the Toubou. The internal composition of the North African part differs too, at 66 per cent Iberomaurusian for the Toubou against 54 for the Fulani. These are two separate crossings of the same desert, in different places and probably at different times, and the only thing they have in common is the desert.
What this method cannot see
Four limits, stated plainly.
The first is dates. Nothing in this article dates anything. A three-source non-negative least squares fit on twenty-five coordinates has no access to segment lengths and therefore no access to time. The published estimate for the age of the lactase persistence allele in the Fulani, somewhere between seven and ten thousand years, comes from a completely different kind of analysis, is an allele age rather than an admixture date, and carries a wide interval; the constraint developed here, that the source carried post-Neolithic Maghrebi ancestry, sits awkwardly beside it. Both cannot be tightened by anything in this dataset. That tension is the most interesting open question in the field and this article does not resolve it.
The second is sampling. Eight population averages, four of them with fewer than twenty individuals and one with two, from four countries out of the ten or more where Fulani communities live. Niger, Mali, Nigeria, Chad and Sudan are all absent, and the eastern half of the Fulani range is represented by two people. The published literature has 460 individuals across eighteen populations and its west-to-east cline is better resolved than the one visible here.
The third is the substrate. The West African pole in this model is a modern Mandinka average, which is a stand-in for whatever the Fulani's African parent population actually was fifteen hundred or three thousand years ago. There is no ancient DNA from the Sahel to check it against. If that substrate has itself changed, every figure in this article shifts with it.
The fourth is the one the first chart illustrates. Genetic distance in this space measures position, not history. Two populations can arrive at the same coordinates by unrelated routes, and in this particular corner of the space, where an African base is combined with a Eurasian-shifted minority, they routinely do. Every conclusion above rests on a fitted model with a reported residual and a stated pole separation, not on which populations happen to be nearby.
The coordinates
The eight Fulani population averages, the two pooled targets, the all-in pooled average and the three panel poles, in Global25 scaled coordinates, for anyone who wants to reproduce the models above in Vahaduo.
Fulani_Gambia_A_n99,-0.597261,0.066338,0.018536,0.010923,0.002608,0.007984,-0.035363,0.035782,-0.031222,0.025808,0.004927,-0.001515,0.018689,-0.001093,0.013827,-0.009762,0.010128,0.000628,-0.002887,-0.001906,-0.001355,-0.003028,0.001205,-0.001288,0.001484
Fulani_Guinea_A_n17,-0.571325,0.068698,0.019632,0.007429,0.003946,0.004790,-0.034077,0.034560,-0.024651,0.026864,0.004700,-0.002460,0.019982,-0.003287,0.014969,-0.010506,0.010461,0.000007,-0.005146,0.000118,-0.000631,-0.005914,0.003118,-0.001035,0.001726
Fulani_Senegal_n25,-0.542071,0.072753,0.014693,-0.001176,0.005736,0.002131,-0.041287,0.037872,-0.010210,0.022780,0.003676,-0.001972,0.018244,-0.004613,0.015157,-0.012251,0.009398,-0.005432,-0.009774,-0.000185,-0.003818,-0.010619,0.006192,-0.001817,0.002165
Fulani_Burkina_Faso_A_n6,-0.492854,0.080396,0.013828,-0.008021,0.005693,-0.001720,-0.045827,0.039806,-0.003306,0.026151,0.004628,-0.000549,0.021110,-0.003257,0.016400,-0.015601,0.005498,-0.009291,-0.012151,0.000646,-0.005158,-0.013478,0.007621,-0.000843,0.003912
Fulani_Guinea_B_n10,-0.463260,0.082766,0.011314,-0.013728,0.011448,-0.004574,-0.037602,0.030114,0.004949,0.026570,0.003313,-0.006339,0.021704,-0.007886,0.018634,-0.014969,0.010952,-0.008146,-0.018754,0.002063,-0.006463,-0.018301,0.010230,-0.002567,0.006083
Fulani_Gambia_B_n73,-0.453609,0.084317,0.012083,-0.016181,0.010775,-0.006078,-0.040100,0.031643,0.008458,0.024754,0.004293,-0.004192,0.021731,-0.006574,0.018581,-0.014714,0.006830,-0.010189,-0.020323,0.001537,-0.006642,-0.017322,0.009878,-0.002281,0.004496
Fulani_Burkina_Faso_B_n49,-0.441378,0.084144,0.010498,-0.018793,0.011374,-0.005731,-0.043913,0.034374,0.010831,0.024189,0.003795,-0.003542,0.022505,-0.007906,0.018078,-0.013010,0.008675,-0.013046,-0.021171,0.002647,-0.005607,-0.019676,0.010079,-0.001901,0.004609
Fulani_Cameroon_n2,-0.389844,0.093937,0.007731,-0.033269,0.013387,-0.014363,-0.041245,0.031730,0.023623,0.022871,0.005764,-0.007418,0.022745,-0.009427,0.019408,-0.018961,0.004629,-0.017546,-0.027717,0.006003,-0.010856,-0.022690,0.017008,0.000723,0.003712
Fulani_pastoralist_pool_n134,-0.448905,0.084281,0.011381,-0.017208,0.011083,-0.005963,-0.041325,0.032528,0.009291,0.024655,0.004060,-0.004163,0.022027,-0.007202,0.018413,-0.014173,0.007779,-0.011191,-0.020627,0.002049,-0.006314,-0.018336,0.010084,-0.002119,0.004644
Fulani_western_pool_n147,-0.580614,0.068275,0.017817,0.007688,0.003421,0.006223,-0.036649,0.036160,-0.025749,0.025429,0.004676,-0.001663,0.018862,-0.002033,0.014290,-0.010510,0.009853,-0.000879,-0.004698,-0.001275,-0.001845,-0.005079,0.002536,-0.001330,0.001727
Fulani_all_pooled_n281,-0.517806,0.075908,0.014748,-0.004184,0.007075,0.000412,-0.038879,0.034428,-0.009040,0.025060,0.004382,-0.002855,0.020371,-0.004498,0.016256,-0.012257,0.008864,-0.005797,-0.012294,0.000310,-0.003976,-0.011401,0.006136,-0.001706,0.003118
Mandinka_Gambia_n232,-0.606618,0.063615,0.017609,0.011757,0.001167,0.008696,-0.036358,0.036933,-0.029232,0.023308,0.004289,-0.001307,0.017473,-0.001167,0.014029,-0.011324,0.009665,-0.000076,-0.002335,-0.001765,-0.000946,-0.003066,0.001498,-0.001065,0.001712
Morocco_Iberomaurusian_Taforalt,-0.189857,0.081242,-0.023382,-0.085918,0.026897,-0.056224,-0.068858,0.018922,0.155684,0.002332,0.022832,-0.032881,0.075728,-0.049434,0.069407,-0.035799,0.007719,-0.064941,-0.141662,0.039344,-0.037908,-0.125483,0.070794,-0.014436,0.019160
Anatolia_Neolithic_Barcin_n22,0.118842,0.181041,0.003548,-0.100835,0.051744,-0.046397,-0.005191,-0.007321,0.036861,0.080971,0.009190,0.012064,-0.023279,0.000982,-0.041820,-0.009106,0.021590,0.000697,0.011753,-0.009470,-0.013102,0.006750,-0.004667,-0.003451,-0.005465
References
- Fortes-Lima, C. A. et al. 2025. Population history and admixture of the Fulani people from the Sahel. American Journal of Human Genetics 112.
- Salem, N. et al. 2025. Ancient DNA from the Green Sahara reveals ancestral North African lineage. Nature 641.
- Vicente, M. et al. 2019. Population history and genetic adaptation of the Fulani nomads: inferences from genome-wide data and the lactase persistence trait. BMC Genomics 20.
- Priehodova, E. et al. 2020. Sahelian pastoralism from the perspective of variants associated with lactase persistence. American Journal of Physical Anthropology 173.
- van de Loosdrecht, M. et al. 2018. Pleistocene North African genomes link Near Eastern and sub-Saharan African human populations. Science 360.
- Fregel, R. et al. 2018. Ancient genomes from North Africa evidence prehistoric migrations to the Maghreb from both the Levant and Europe. PNAS 115.
- D'Atanasio, E. et al. 2018. The peopling of the last Green Sahara revealed by high-coverage resequencing of trans-Saharan patrilineages. Genome Biology 19.
- Cerny, V. et al. 2011. Internal diversification of mitochondrial haplogroup U5b1b in Sahelian pastoralists. American Journal of Physical Anthropology 145.
- Dunne, J. et al. 2012. First dairying in green Saharan Africa in the fifth millennium BC. Nature 486.
- Global25 coordinates by Davidski, Eurogenes Blog. Population averages from the Moriopoulos 2026 collection. Modelling performed in Vahaduo-compatible form.