
Haplogroup I1 is carried by something like a third of Swedish men, a third of Norwegian men and a third of Danish men, and it is the closest thing there is to a Scandinavian paternal signature. It is also, on the ancient evidence, a lineage that spent two thousand years going almost nowhere and then took over a peninsula in about three centuries. This article does three things with a Global25 calculator and a database of typed ancient male burials. It locates the two oldest carriers, who turn out to be neither Scandinavian nor related to each other in any population sense. It measures the horizon at which the lineage explodes, which is the Late Neolithic Dagger Period rather than the Corded Ware or the Bell Beaker. And it asks whether the men carrying it were genetically distinguishable from the men buried beside them, which they were not, and that negative result is the whole point.
A lineage with almost no depth
Every haplogroup has a shape, and I1 has an unusual one. The lineage is defined by the marker M253 and sits inside the wider I clade, whose other main branch, I2, is all over Mesolithic and Neolithic Europe from Spain to the Balkans and has the sprawling, deeply split structure you expect from a lineage that has been in place for tens of thousands of years. I1 does not look like that at all. Its living branches coalesce to a common ancestor in the third millennium BC on the published trees, and below that node the structure fans out very fast into DF29 and its descendants, which is what a lineage looks like when a single man in a single region has an extraordinary number of surviving male-line descendants and almost nobody else in his branch does.
That is a bottleneck, and bottlenecks leave two kinds of trace. In living populations they leave a lineage that is common and shallow. In ancient DNA they should leave a moment: a horizon before which the lineage is essentially unfindable and after which it is everywhere in one place. The database used here contains 113 typed ancient individuals whose Y chromosome resolves to M253 or below. That is enough to go looking for the moment.
The two oldest carriers have nothing in common
Setting aside a handful of calls that cannot be real, and which get their own section below, the oldest defensible I1 individuals in the database are not Scandinavian. They are German, and they predate the arrival of steppe ancestry in northern Europe.
OST003 comes from Ostorf in Mecklenburg, dated to about 3222 BC, sequenced to over a million SNPs, so the call is not a coverage artefact. Ostorf is a well known and rather strange site: a lakeside cemetery of people living in a fully Neolithic landscape, surrounded by farming communities, who are genetically not farmers. Under the three-source panel used throughout this article OST003 comes out at 79 per cent western hunter-gatherer, 6 per cent Anatolian Neolithic and a steppe figure that is model noise on a target this far outside the panel. He sits 92 units from the Loschbour genome and 310 units from the Funnel Beaker farmers of Sweden. The oldest man in this dataset carrying the lineage that would become the Scandinavian paternal signature was, in ancestry terms, a hunter-gatherer.
The other early cluster is at Warburg in Hesse, three individuals from the Wartberg culture between about 3185 and 3111 BC, buried in a collective gallery grave. The one with coordinates, Warburg_2, decomposes to 66 per cent Anatolian Neolithic farmer and 32 per cent western hunter-gatherer, with essentially no steppe, and sits 26 units from the Wartberg group average. He is an ordinary Late Neolithic central European farmer.
So within a hundred years of each other, in two regions of Germany four hundred kilometres apart, the lineage turns up in a hunter-gatherer-descended fishing community and in a farming community, populations that sit 257 units apart from one another. Whatever I1 was doing in the fourth millennium, it was not confined to one people. It was a minor lineage circulating in the pre-steppe north European plain, at a frequency low enough that four carriers out of 129 typed males is all the sampling has found.
Data and method
Ancestry proportions come from Global25 scaled coordinates, with population averages merged from Davidski's published files and the Moriopoulos 2026 collection, and non-negative least squares with a sum-to-one constraint imposed by appending a heavily weighted row of ones, the resulting weights normalised. Distances are scaled Euclidean distances multiplied by one thousand, the convention used throughout this site.
Haplogroup assignments and dates come from a curated ancient DNA database of typed burials, queried on the full SNP path rather than on the ISOGG shorthand, because the shorthand is unstable across publication decades and the path is not.
One panel does the work in every decomposition below, so that rows are directly comparable: the Yamnaya of Samara, the Anatolian Neolithic of Barcin, and the western hunter-gatherer genome from Loschbour. Its condition number is 2.44 and its three pole separations are 338, 410 and 494 units. This is the identical panel used in our articles on the Corded Ware and on Iron Age Britain, so the rows here can be read directly against the rows there. Substituting the steppe pole from Samara to the Yamnaya of Kalmykia moves the headline figure by four tenths of a point.
The pooled Dagger Period target is a weighted average of 43 individuals from Denmark, Sweden and central Norway. One honest note on dating: the dated Global25 sample file and the curated database disagree on several individuals by three or four centuries, in one case placing the same Zealand burial at 2294 BC and at 1889 BC. Where a date matters to the argument below it is flagged, and no claim here rests on a single burial's calendar position.
Where the Dagger Period sits
Before the lineage, the population it expanded inside.
Every population within reach of the pooled Dagger Period average, ranked by Global25 distance. Living Norwegians sit closer than any Bell Beaker group, and far closer than the Corded Ware population that preceded them in the same landscape.
Three things on that chart.
The first is the position of the moderns. Norwegians sit 20.0 units from a pooled average of people buried in Scandinavia around 2000 BC, Swedes 21.3, Danes 21.8. Three and a half thousand years, the Bronze Age, the Iron Age, the Migration Period, the Viking Age, the Hanseatic centuries and the modern era, and the population has moved about twenty units. Whatever happened in Scandinavia after the Dagger Period, it did not involve replacing anybody.
The second is the position of the Corded Ware. The Battle Axe culture of Sweden sits 33.8 units away and the Single Grave culture of Denmark 52.7, both further than every Bell Beaker group on the chart and further than the Unetice culture of Germany at 19.7. The Dagger Period population is not simply the Corded Ware population of the same peninsula grown older. Something arrived in between.
The third is the bottom of the chart, and it is the answer to the origin question in its crudest form. Warburg_2 sits 145.7 units away and OST003 264.0. The men who carried this lineage in the fourth millennium belong to populations that have nothing to do, in coordinate terms, with the population that carried it a thousand years later. The lineage travelled. The ancestry did not travel with it.
The dilution, and where it came from
Breaking the same populations into ancient components gives the shape of each gene pool.
The identical three-source panel applied to the Scandinavian sequence, to the Bell Beaker groups of the continent, and to the modern Scandinavian populations.
The Single Grave culture of Denmark comes out at 64.8 per cent steppe and the Battle Axe culture of Sweden at 62.0. The Dagger Period returns 52.3 in Denmark, 49.9 in Sweden and 55.2 in central Norway, and the Nordic Bronze Age of Denmark 52.6. That is a drop of roughly twelve points of steppe ancestry across the transition, absorbed as farmer ancestry, and it happens in the same landscape within a few centuries.
Where the incoming twelve points came from is legible in the same rows. The Bell Beaker groups of the Netherlands sit at 60.9 per cent steppe, which is too high, but the Bell Beaker of Saxony-Anhalt sits at 48.5 and the late Bell Beaker of Bohemia at 49.5, which is to say inside the Dagger Period range rather than outside it. The Unetice culture of Germany is the closest single population on the distance chart at 19.7 units. The Scandinavian Late Neolithic looks like the Corded Ware substrate of the peninsula plus a substantial contribution from the Beaker-derived and post-Beaker populations of the central European plain.
And then it stops moving. Swedes return 52.0 per cent steppe, Danes 50.4, Norwegians 51.0, against 52.0 for the pooled Dagger Period. The gene pool that formed in Scandinavia in the centuries around 2000 BC is, to the resolution of this method, the gene pool that is there now.
The moment
Now the lineage itself, counted rather than described.
I1 as a proportion of typed male burials, by region and horizon. The lineage is absent from the Scandinavian Neolithic entirely and near-fixed in the Swedish Bronze Age sample.
Read that chart from the bottom. Among 72 typed males from the Swedish Middle and Late Neolithic, chiefly Funnel Beaker and Pitted Ware, there is not one I1. Among 26 from the Danish Neolithic, not one. Among 97 from Poland across every horizon down to 1100 BC, not one. Among 118 males from the German Bell Beaker horizon, not one, and among 30 from the German Early Bronze Age, not one. The lineage is not in the Scandinavian substrate, and it is not in the Bell Beaker paternal pool either, which is overwhelmingly R1b and specifically P312.
Then the Corded Ware horizon: one carrier in fourteen typed Danish males, one in eighteen Swedish. Then the Dagger Period: eight of twenty-two in Denmark, eleven of fifteen in Sweden. Then the Nordic Bronze Age: five of nine in Denmark, three of three in Sweden. The Swedish and Norwegian denominators are small and the percentages should be read as ordering rather than as arithmetic, but the Danish sequence rests on decent numbers and it moves from zero to seven per cent to thirty-six to fifty-six across roughly eight hundred years.
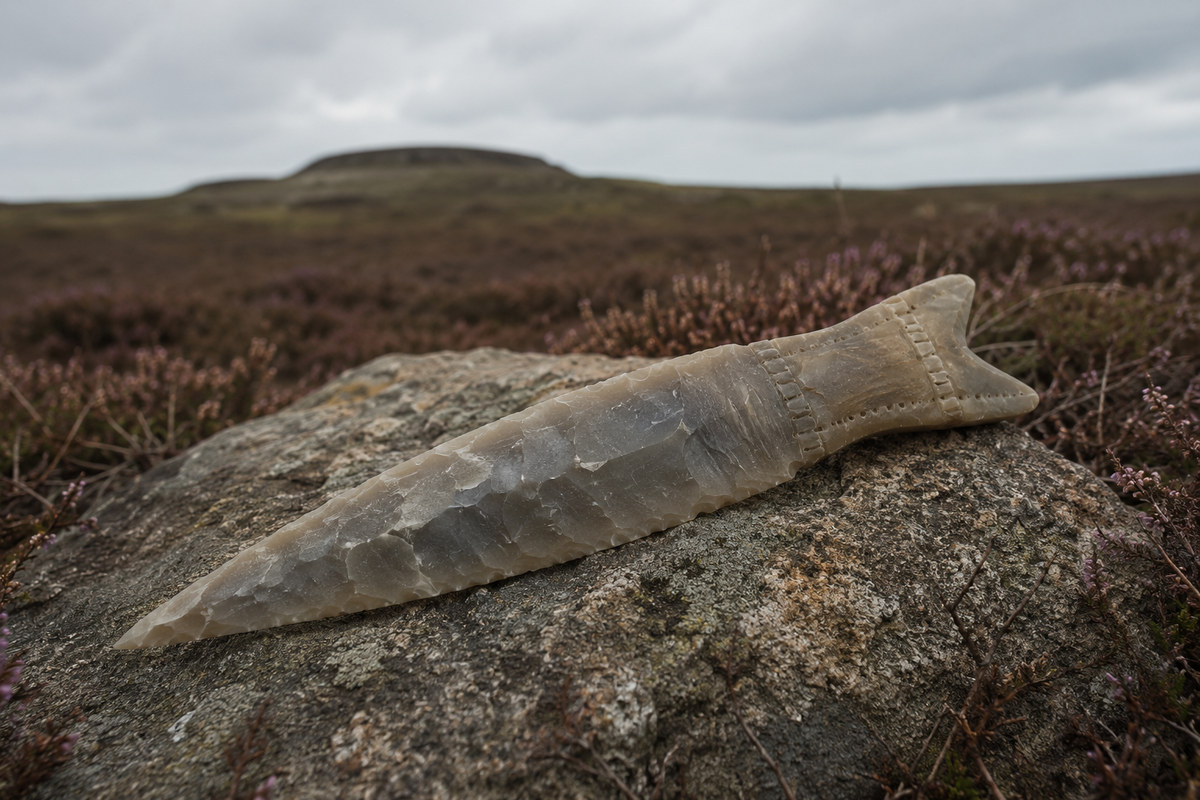
That is the bottleneck, dated. It is not the Corded Ware expansion, which brought R1a and R1b into the peninsula and in which I1 is a rounding error. It is not the Bell Beaker expansion, which never reached Scandinavia demographically and whose sampled males carry none of it. It is the Late Neolithic Dagger Period, the phase of flint daggers and Unetice-facing metal contacts and the formation of the Nordic Bronze Age package, and it is the same horizon in which the steppe fraction of the population drops twelve points.
The carriers are not a population
Which raises the obvious question. If the lineage arrived, did it arrive attached to an incoming group that a calculator can see?
Twenty-four I1 carriers with usable coordinates, plotted against date. The group average of their contemporaries is the dashed line.
The twenty-four I1 carriers with coordinates pool to 49.8 per cent steppe, 32.9 per cent Anatolian Neolithic and 17.3 per cent western hunter-gatherer. Sixty contemporaneous Scandinavian individuals who are not among them pool to 53.4, 31.3 and 15.3. The two pooled averages sit 17.5 units apart.
That gap has to be read against a scale. The median I1 carrier sits 29.3 units from the I1 average, and the median non-carrier sits 28.6 units from the non-carrier average. The entire difference between the two groups is smaller than the ordinary scatter of individuals inside either one. To the resolution of Global25 these are not two populations. They are one population, sorted by a marker on a chromosome that carries no autosomal information at all.
The individual plot says the same thing in a different way. Across twelve centuries the carriers run from 41.8 to 58.4 per cent steppe with no trend, no clustering and no subgroup. If an I1-bearing population had walked into Scandinavia and out-reproduced the locals, the early carriers should look different from the late ones and different from their neighbours. They do not.
The honest reading is that a lineage already present at very low frequency in the northern European gene pool caught a demographic wave that it did not create. Something about the Dagger Period, and the candidate explanations are social rather than genetic, gave a small number of men an enormous reproductive advantage, and the man at the base of the surviving I1 tree was one of them.
The calls that cannot be real
Any database of ancient Y assignments has a floor of false positives, and it is worth showing this one rather than quietly filtering it, because the pattern is instructive.
Querying for M253 without a date filter returns an individual from Cariguela in Spain at a nominal 22500 BC, an Azilian burial at 11065 BC, a Swedish Mesolithic hunter-gatherer at 6942 BC assigned below L840, a Hungarian Linearbandkeramik burial at 5050 BC, and a French Chasseen burial at 4183 BC assigned all the way down to Z138 and beyond. Every one of these predates the coalescence of all living I1 by thousands of years, and the last is assigned to a branch that would not exist for another two millennia.
These are not frauds, they are the expected behaviour of pseudo-haploid ancient genotypes on a tree where I1 and I2 share a long ancestral trunk. A low-coverage I2 individual with a handful of ancestral reads at the diagnostic positions gets walked down the wrong branch, and a caller that reports the deepest reachable node will happily report a subclade that postdates the burial. The Cariguela date is itself a giveaway: its dating method is recorded as archaeological context with a range from 40000 to 5000 BC, which is not a date.
The lesson generalises. When a haplogroup assignment and a radiocarbon date are mutually impossible, the assignment is usually the thing that is wrong, and any analysis that takes the oldest hit in a database as the origin of a lineage will be reconstructing a sequencing artefact.
The return south
One last row, because it closes the circle. The lineage vanishes from Germany after the Neolithic: zero carriers in 118 Bell Beaker males, zero in 30 Early Bronze Age males, one in 25 in the Middle and Late Bronze Age. Then in the Iron Age it is back, at 62 of 335 typed German males, 43 of 111 Polish, and 3 of 42 Dutch.
The Polish figure is the interesting one, because of where it sits. Almost all of it comes from the Wielbark cemeteries of Pomerania and the Maslomecz group of the Lublin region, which is to say from the archaeological horizon conventionally associated with the Goths, and the same lineage turns up in the same centuries in Late Antique Bulgaria, in Roman Serbia, in Merida in Spain and in Punic Sardinia. Nine centuries later it is in the Saxon cemeteries of eastern England at West Heslerton and Oakington.
A lineage that was a minor component of the pre-steppe north European plain, that became near-dominant in one peninsula during one Late Neolithic phase, and that was then redistributed across half of Europe by the movements of the people who spoke Germanic languages. The Scandinavian bottleneck is the hinge, and everything after it is dispersal.
What this method cannot see
Three limits, stated plainly.
A Global25 coordinate is an autosomal summary inherited equally from both parents. It cannot tell you anything about the Y chromosome, and every statement above linking the two is a statement about correlation between two independent datasets rather than a measurement of one thing.
Frequencies in ancient DNA are frequencies in cemeteries, not in populations. Burial is selective everywhere and it was strongly selective in Late Neolithic Scandinavia, where megalithic reuse, cremation and bog deposition all remove people from the record in non-random ways. The rise from seven per cent to thirty-six per cent in Denmark is a rise in who was buried in a way that preserved them and who was chosen for sequencing.
And the small denominators are small. Three Swedish Bronze Age males returning three I1 carriers is a hundred per cent and it is also three men. The Danish column carries the argument; the Swedish and Norwegian columns corroborate it.
The coordinates
The twenty-four I1 carriers used in the individual analysis, in Global25 scaled coordinates, for anyone who wants to reproduce the models above in Vahaduo.
Denmark_TRB_N_CWC.SG:NEO875,0.118376,0.122879,0.042615,0.063631,0.029544,0.025937,0.007285,0.006000,-0.011453,-0.017677,-0.006820,0.007194,-0.011150,-0.002890,0.005157,0.020684,-0.019688,0.006461,0.015335,0.000250,0.008485,0.004699,-0.006902,0.001566,0.006586
Sweden_LN.SG:NEO261,0.125205,0.135065,0.065242,0.067830,0.043700,0.018965,0.004465,0.010153,0.014317,-0.005103,-0.008931,0.002548,-0.003122,0.002615,0.025923,-0.004906,-0.017993,0.001140,0.005531,0.013506,0.014474,0.007543,-0.003204,0.009278,-0.006227
Sweden_Fralsegarden_Steppe2.SG:FRA301,0.126344,0.129988,0.068636,0.052649,0.045239,0.024542,0.007520,0.009230,0.014521,0.000000,-0.011205,0.001649,-0.007284,-0.000275,0.021037,0.020154,0.010822,0.001900,0.001508,0.015132,0.020339,0.003339,-0.001356,0.006989,0.000120
Sweden_Nastegarden_Steppe2.SG:NAS002,0.133173,0.135065,0.065996,0.062985,0.054164,0.025937,0.003760,0.011999,0.004909,0.002005,-0.006658,0.007194,-0.016799,-0.001927,0.010586,0.034871,0.005215,0.003421,0.007542,0.019384,0.006988,0.006554,0.004314,0.022051,0.006466
Sweden_LN_EBA.SG:NEO220,0.124067,0.137096,0.074293,0.059432,0.039084,0.019243,0.003995,0.013153,0.018407,-0.007472,-0.001624,-0.007194,-0.007582,-0.005505,0.025380,0.006895,-0.004563,-0.002534,0.012696,0.015257,0.010357,0.008903,0.003944,0.019762,-0.008263
Sweden_LN_EBA.SG:NEO227,0.144555,0.125926,0.082589,0.071383,0.043393,0.009203,0.009635,0.008077,0.015135,-0.008747,0.008769,0.003147,-0.008622,-0.006331,0.007736,0.023336,0.014473,0.011782,0.011061,0.013506,0.008859,0.004575,0.002711,0.016870,-0.005748
Denmark_Zealand_BA:CGG105333,0.125205,0.139128,0.073539,0.059109,0.034468,0.019801,0.000000,0.009230,0.007363,-0.001276,-0.005359,0.000749,-0.012190,-0.006055,0.018729,0.011933,-0.011343,0.007475,0.003017,0.010005,0.009358,0.010387,0.000739,-0.001687,-0.004670
Norway_Central_Trondelag_LN:CGG105650,0.129758,0.122879,0.075424,0.059109,0.047393,0.019801,0.006345,0.003692,0.011862,-0.008018,-0.009419,0.003897,-0.009812,-0.011836,0.019137,0.009149,-0.009127,0.010008,0.007039,0.009254,0.016845,0.006430,-0.001479,0.001084,-0.001796
Sweden_LN_EBA.SG:NEO228,0.128620,0.135065,0.086361,0.056202,0.048624,0.019801,0.013866,0.008077,0.010635,-0.004009,-0.003248,0.001499,-0.023786,-0.006606,0.026465,0.007558,-0.002217,0.012922,0.004022,0.007754,0.017469,-0.001607,0.001849,0.010363,-0.000239
Denmark_Zealand_LN:CGG106702,0.128620,0.126941,0.071276,0.061693,0.049240,0.025658,0.004935,0.009461,0.005727,-0.009112,-0.005034,0.001499,-0.005649,-0.014313,0.012351,0.019888,0.006519,0.004434,0.009679,0.013632,0.007986,0.000371,0.000123,0.021087,-0.000718
Sweden_Late_N.SG:oll009,0.128620,0.135065,0.070522,0.062339,0.043085,0.017012,0.001880,0.003692,0.005522,0.002734,-0.002111,0.011690,-0.014271,-0.002615,0.026330,0.006762,-0.014473,0.008108,0.006536,0.006003,0.010606,-0.006925,-0.010476,0.003374,-0.000718
Sweden_Nastegarden_Steppe2.SG:NAS001,0.135449,0.126941,0.082589,0.069122,0.044008,0.019243,0.000470,0.013384,0.011453,-0.006196,-0.013316,-0.002847,-0.013379,-0.011010,0.016829,0.030496,0.006650,0.001900,-0.001131,0.025762,0.010606,0.004575,0.010846,0.001807,0.002515
Denmark_SouthScandinavia_LN.SG:NEO93,0.125205,0.128972,0.063733,0.064277,0.042469,0.019801,0.006110,0.005307,0.002863,-0.010387,0.004060,0.002548,-0.005203,-0.003578,0.019544,-0.010209,-0.021644,-0.001014,0.006913,0.000375,0.006738,0.006183,0.002588,0.009760,-0.004191
Denmark_Zealand_BA:CGG105334,0.125205,0.139128,0.066750,0.064923,0.034776,0.017849,0.004465,0.009923,0.004909,-0.006014,-0.002923,-0.002847,-0.006838,-0.019267,0.017779,0.024794,0.003129,-0.002787,-0.004902,0.007379,0.013351,0.001731,0.000863,0.003374,0.004790
Denmark_Zealand_LN:CGG105332,0.112685,0.129988,0.068636,0.062016,0.035391,0.024263,0.002115,0.001846,0.005727,-0.005649,-0.003248,-0.013488,-0.003122,-0.004129,0.026330,0.008618,-0.006258,0.011529,0.003520,0.002126,0.011854,0.006183,0.008751,0.009278,-0.008981
Denmark_Lolland_LN:CGG106712,0.122929,0.128972,0.085229,0.074936,0.046470,0.015618,0.004230,0.006461,0.008795,0.004374,-0.000974,-0.006744,-0.011001,-0.020919,0.019137,0.014320,-0.000391,0.010008,0.009553,0.004002,0.012228,0.005812,-0.002465,0.007109,-0.001317
Denmark_SouthScandinavia_EBA.SG:NEO815,0.130897,0.146236,0.087115,0.071383,0.052317,0.020638,0.003525,0.008538,0.025565,0.004556,-0.021598,0.001948,-0.016799,0.015276,0.025515,0.007292,-0.017211,0.001394,-0.006034,-0.001251,0.022460,-0.006677,-0.004190,-0.001446,0.005987
Denmark_SouthScandinavia_EBA.SG:NEO563,0.126344,0.127957,0.067882,0.059109,0.043393,0.024821,0.013631,0.015692,-0.001432,-0.002369,-0.006658,0.001199,-0.009663,-0.012524,0.008822,0.015380,0.005215,-0.000127,0.003771,0.009004,0.011605,0.004822,-0.005300,-0.001446,-0.000239
Denmark_Zealand_EBA:CGG106515,0.128620,0.133034,0.077310,0.063631,0.045547,0.024542,0.007520,0.013384,0.004500,-0.004738,-0.013965,0.002698,-0.007582,0.000000,0.027416,-0.000796,-0.024643,-0.003421,0.002765,0.009129,0.021213,0.011129,-0.006286,0.010122,0.007784
Denmark_EBA:CGG107525,0.134311,0.128972,0.069013,0.060401,0.051394,0.031794,-0.007520,0.008538,0.014521,0.004374,-0.007632,0.011839,-0.008920,0.000826,0.020087,0.002784,-0.024251,-0.012796,0.013073,-0.002376,0.019715,0.007914,-0.008381,0.008314,-0.001437
Denmark_SouthScandinavia_EBA.SG:NEO590,0.127482,0.132019,0.069390,0.057494,0.038776,0.020359,0.002585,-0.000231,0.006954,0.001640,-0.010718,0.004496,-0.011893,-0.015276,0.017101,0.009944,0.012386,0.003041,0.011187,0.015382,0.010981,0.005070,-0.005793,0.011568,-0.000718
Norway_Central_Trondelag_EBA:CGG105645,0.133173,0.129988,0.069013,0.073321,0.045547,0.022311,0.004465,0.014076,0.005113,-0.006925,-0.010393,0.000899,-0.005500,-0.012799,0.018458,0.008353,-0.007823,0.005828,0.001383,0.005878,0.003868,0.008161,0.003697,0.014098,0.001676
Sweden_BA.SG:RISE175,0.122929,0.139128,0.076933,0.065246,0.033852,0.013945,0.019271,0.012461,0.005113,-0.004556,0.001786,-0.004346,-0.009217,-0.008670,0.014115,0.026783,0.015255,-0.001520,-0.017221,0.001000,-0.001123,0.000000,0.010969,-0.007109,0.001437
Sweden_FirseSten_Steppe2.SG:FIR001,0.127482,0.134050,0.068259,0.057494,0.047393,0.025100,0.005875,0.008769,0.002454,-0.002916,-0.000812,0.003297,-0.012933,-0.006881,0.019679,0.011138,-0.012517,-0.001140,0.007668,0.004877,0.010981,0.010263,-0.003697,0.016508,-0.004431
References
- Allentoft, M. E. et al. 2024. Population genomics of post-glacial western Eurasia. Nature 625.
- McColl, H. et al. 2024. Steppe ancestry in western Eurasia and the spread of the Germanic languages. Preprint.
- Seersholm, F. V. et al. 2024. Repeated plague infections across six generations of Neolithic Farmers. Nature 632.
- Posth, C. et al. 2023. Palaeogenomics of Upper Palaeolithic to Neolithic European hunter-gatherers. Nature 615.
- Malmstrom, H. et al. 2019. The genomic ancestry of the Scandinavian Battle Axe Culture people. Proceedings of the Royal Society B 286.
- Stolarek, I. et al. 2023. Genetic history of East-Central Europe in the first millennium CE. Genome Biology 24.
- Gretzinger, J. et al. 2022. The Anglo-Saxon migration and the formation of the early English gene pool. Nature 610.
- Global25 coordinates by Davidski, Eurogenes Blog. Population averages from the Moriopoulos 2026 collection.