
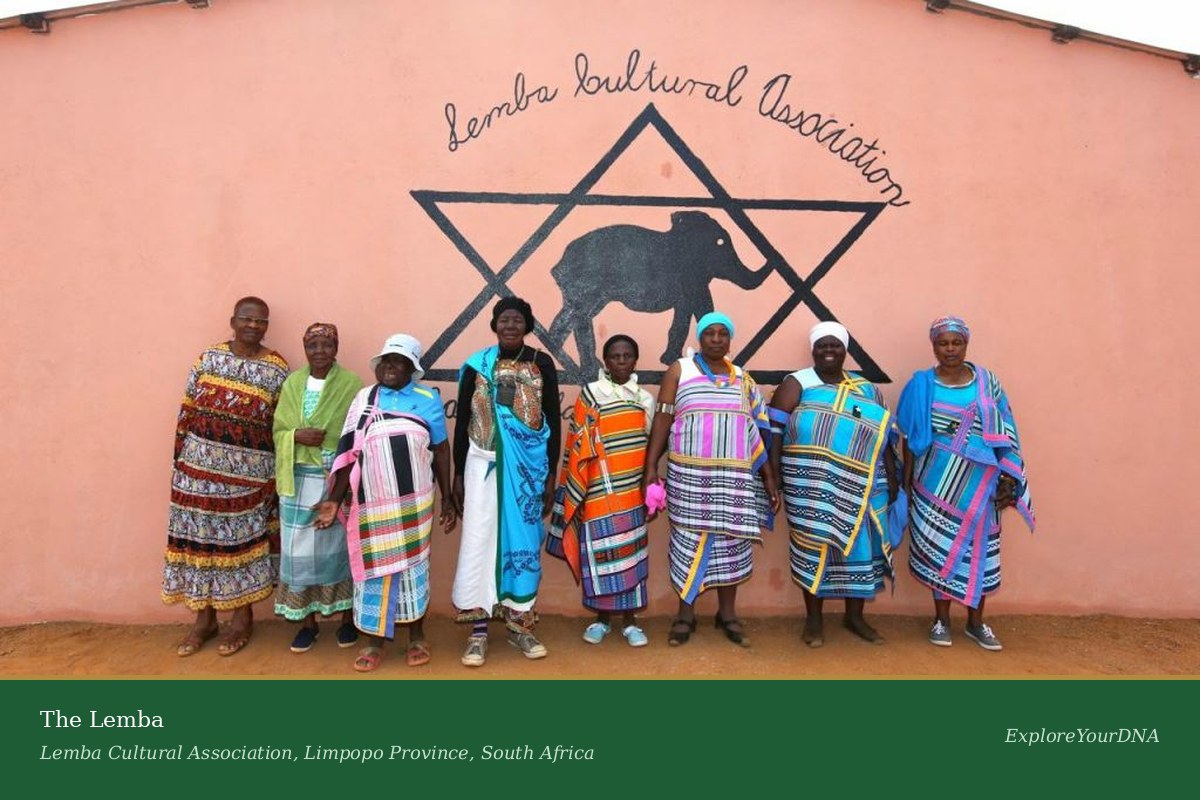
In 1997 a British anthropologist followed a sacred drum and an oral tradition from the northern Transvaal to a ruined town in eastern Yemen, and three years later a genetics paper appeared to prove him right. The Lemba, a Bantu-speaking people of South Africa and Zimbabwe who circumcise their sons, refuse pork, slaughter animals in a prescribed way, bury their dead facing north and marry only among themselves, claim descent from Jews who left a place they call Sena. In 2000 a team reported that Lemba men carried the Cohen Modal Haplotype, the Y chromosome signature then believed to mark the Jewish priesthood, and that it was concentrated in the senior Buba clan. The story went round the world. Two decades later almost every load-bearing part of it has been quietly withdrawn by the same field that produced it, and yet the underlying question, whether a Middle Eastern founding population really did walk into the Limpopo valley, remains open and interesting. This article looks at what the genetic evidence can carry and what it cannot, runs the modelling that would be needed to answer it, and reaches a conclusion that is neither the headline nor its debunking.
A Drum, a Chromosome and a Headline
The Lemba, who call themselves VhaLemba in South Africa and Remba in Zimbabwe, are not a large population. They live scattered among much bigger neighbours: the Venda of Limpopo Province, the Northern Sotho or Pedi of Sekhukhuneland, and the Shona and Kalanga of southern Zimbabwe. They speak their neighbours' languages. What sets them apart is a set of practices that any visitor from the Mediterranean world would recognise immediately, and an oral tradition that explains them. Their ancestors, they say, came from a great city across the sea called Sena, where they were skilled in metalwork, pottery, weaving and shipbuilding. They came to trade, especially for gold. They left men behind with unsold cargo, established posts, moved inland, and married local women because they had brought none of their own.
That last detail matters enormously, and we will come back to it, because it is the single most testable claim in the whole tradition.
The genetics arrived in stages. In 1996 Spurdle and Jenkins found that a little over half of Lemba Y chromosomes fell into types shared with Semitic-speaking populations rather than with their Bantu-speaking neighbours. In 2000 Thomas, Parfitt and colleagues went further, typing 399 Y chromosomes across Lemba, Bantu, Yemeni Hadramaut, Yemeni Sena, Sephardic and Ashkenazi Jewish samples. They found the Lemba paternal pool split cleanly into a Bantu component and a Semitic one, and they found that possession of the Cohen Modal Haplotype was very strongly associated with membership of the Buba clan, the clan the Lemba themselves regard as the senior and oldest lineage, and the one their elders name as having led them out of Judea.
It is hard to overstate how satisfying that result looked. An oral tradition names a founding lineage. A genetic marker believed to track the Jewish priesthood turns up concentrated in exactly that lineage. Tudor Parfitt had independently identified a ruined settlement called Sena in the eastern Hadramaut. The pieces fitted so neatly that they were reported as proof rather than as evidence.
What Happened to the Cohen Modal Haplotype
The Cohen Modal Haplotype was defined in 1998 on six Y chromosome microsatellites. Six markers is not very many. The problem, recognised within a few years and settled by the end of the decade, is that a six-marker haplotype is a coarse object: it can arise independently on different backgrounds, it is shared across populations that have no common recent history, and it turns out to be reasonably common in Arabic-speaking groups across the Middle East who make no claim to Jewish descent at all.
Hammer and colleagues resolved this in 2009 by extending the definition from six markers to twelve, on a specific and much narrower haplogroup background known as J-P58. That extended version does behave like a genuine founder lineage: it dominates among self-identified Cohanim in both Ashkenazi and non-Ashkenazi communities, it is essentially not found in non-Jewish populations, and its diversity dates to roughly 3,200 years ago with wide error bars. The original six-marker version, by contrast, looks on current evidence like an old and widely distributed Arabian haplotype, with an ancestry running many thousands of years deeper than any Jewish community.
So the marker that made the Lemba famous was reclassified as not diagnostic, and the obvious next step was to go back and look for the extended version. Himla Soodyall did exactly that in 2013, and this is the study that should be far better known than it is.
Soodyall sampled 261 men: 76 Lemba from South Africa, 54 Remba from Zimbabwe (sampled for the first time), 43 Venda as the local comparison, and 88 South African Jews. The headline confirmation held up. The non-African component of the Y chromosome pool came out at 73.7 percent in the Lemba and 79.6 percent in the Remba, which is an extraordinary figure for a Bantu-speaking population of the southern African interior and is not remotely explicable as noise. Something non-African, male and substantial really did enter this community.
But when the haplogroup J chromosomes were resolved at high resolution and screened for the extended twelve-marker Cohen haplotype, it was absent from the Lemba and Remba entirely. Twenty-four men carried the old six-marker version, ten of them Lemba and fourteen of them South African Jews, and exactly one man in the whole sample carried the extended version, and he was a South African Jew. Soodyall's conclusion was carefully worded: the origin of the non-African Y chromosomes could not be traced with confidence, and the study did not support the earlier claim of a Jewish genetic heritage.
Note what that conclusion does and does not say. It does not say the Lemba are not of Middle Eastern descent. It says the specific evidence offered for a specifically Jewish descent evaporated when the resolution was increased. Those are very different statements, and almost every popular account of this story has collapsed them into one or the other.
The Test That Cannot Be Run Here
At this point the natural move for anyone working in Global25 coordinate space is to pull up the Lemba average and model it. That is not possible, and it is better to say so plainly at the start than to fudge it. There is no Lemba or Remba population in the Global25 dataset, none in the Moriopoulos 2026 collection, and no genome-wide autosomal study of the Lemba in the peer-reviewed literature comparable to what exists for their neighbours. Every genetic claim about this population that has ever been published rests on uniparental markers: the Y chromosome, and one unpublished doctoral survey of mitochondrial DNA.
That is a real gap and it is worth asking why it exists. Part of it is simply that the Lemba are a small population that has already been studied intensively, with mixed feelings about the results; the anthropologist Noah Tamarkin has written a whole book on what the 2000 paper did to Lemba political and religious life. Part of it is that the large African genome panels have concentrated on linguistic and geographic sampling frames rather than on communities defined by religious identity.
What can be done, and what the rest of this article does, is to ask a different and more useful set of questions. If a Middle Eastern founding layer of the kind the Lemba describe exists in their genome, what size would it be? Would a Global25 model detect it? And, crucially, if it detected it, could it tell a Jewish source from an Arab one? That last question is the one the entire controversy turns on, and it can be answered exactly, right now, without a single Lemba sample.
The Two Distances That Decide Everything
Every model of this kind lives or dies on how far apart its source populations sit. Two sources that are close together in coordinate space cannot be told apart no matter how good the algorithm is, because the target genuinely does sit almost equally near both. So before running anything, it is worth simply measuring the distances involved.
The picture could hardly be more lopsided. The contrast the model will be dominated by, sub-Saharan African against Arabian, runs from 0.67 to 0.83, which is about as large as distances between human populations get. Against that, the two candidates at the heart of the Lemba question, a Yemenite Jewish source and a Yemeni Arab source, sit 0.031 apart. A Yemenite Jewish source and a Saudi Arab source sit 0.014 apart, which is roughly the distance separating neighbouring districts within a single European country.
The ratio is the point. The signal the model is being asked to detect is more than twenty times larger than the difference it is being asked to attribute. That is not a subtle statistical caveat, it is a structural feature of the problem, and it applies to every calculator, every commercial ancestry report and every hobbyist model that has ever assigned a Jewish percentage to anybody on the basis of autosomal DNA alone.
Notice also that Yemenite Jews are further from Ashkenazi and Iranian Jews than they are from Yemeni Arabs or Saudis. That is exactly what a thousand years of endogamy inside different host regions produces, and it is a useful reminder that "Jewish" is not a coordinate-space location. It is a set of communities, each of which sits close to its regional neighbours.
Does the Instrument Work at All?
Having established that identification will be hard, the next question is whether quantification is even possible. The model used throughout the rest of this article is a four-source NNLS fit with a sum-to-one constraint, using a Bantu source (Cameroonian Bantu), a Khoisan source (Ju/'hoansi), a Nilotic source (Dinka) and one Middle Eastern source. Its condition number is 8.5, which is very comfortable, and the three African poles are separated by 0.19 to 0.49, well above the threshold at which collinearity artifacts appear.
The first test is a negative and positive control run side by side. Southern African Bantu-speaking populations are the Lemba's actual neighbours and intermarriage partners, and should show essentially nothing. The Swahili of the Kenyan coast, by contrast, are the textbook case of precisely the process the Lemba tradition describes: Indian Ocean traders who arrived by sea, settled in coastal towns, married local women and founded lineages. If the model cannot see the Swahili, it cannot see anything.
It sees both, and it separates them by a factor of thirty or more. Sotho, Zulu and the pooled South African Bantu sample return a flat zero. Tswana returns 0.12 percent and Xhosa 1.17 percent, small and stable readings that do not move when the Middle Eastern pole is swapped. West and Central African controls return zero. The Swahili towns, meanwhile, come out between 18 and 48 percent, with Pate, Faza, Siyu and Tchundwa all above 40.
Those Swahili numbers are worth pausing on, because they are independently checkable. The Brielle and Kusimba study of 2023 sequenced 80 medieval and early modern individuals from six Swahili coastal towns and found that many carried roughly half their ancestry from Asian sources, with 80 to 90 percent of that Asian component traceable to Persian men, and that the mixing began around AD 1000 alongside the adoption of Islam. Later arrivals shifted increasingly Arabian after about 1500. A crude four-source model in coordinate space reproducing that scale of admixture from present-day samples, without being told anything about it, is a reasonable sign that the instrument is measuring something real.
How small a layer can it see? The clean way to find out is to mix a known quantity into a real population that is not one of the model's sources and ask the model to recover it.
The recovery is essentially exact all the way down. A half-percent injection comes back as 0.47 percent, one percent as 0.97, five percent as 4.97, twenty percent as 19.98. There is no baseline to subtract because the South African Bantu average returns a true zero before injection. This is one of the most sensitive detection floors this site has ever measured, and the reason is the same geometric one as before: when the sources are 0.7 apart, even a tiny share of one of them moves the target detectably.
So the instrument works. If the Lemba carry a Middle Eastern autosomal layer of one percent or more, a Global25 model built on their neighbours would find it, and would report its size to within a fraction of a point. That is a genuinely useful thing to know, and it means the missing Lemba dataset is a solvable problem rather than an impossible one.
The Experiment That Settles the Argument
Now the question that matters. Suppose that dataset existed, and suppose it showed a Middle Eastern layer of, say, ten percent. Could the model tell us whether that layer came from a Jewish community or an Arab one?
This can be tested directly and without any ambiguity, because we can build the answer ourselves. Take the South African Bantu average, inject exactly ten percent of a known Middle Eastern source into it, and then offer the model twelve candidate sources one at a time, recording how badly each one fits. If the method has any power to identify sources, the true source should win. Then do the whole thing again with a different true source, and see whether the ranking changes.
The true source does not win. When the injected layer is Yemenite Jewish, the best-fitting candidate is Saudi Arab, with Bedouin from the Negev second and the actual Yemenite Jewish source third, beaten by 0.89 percent on residual. When the injected layer is Yemeni Arab, the best-fitting candidate is again Saudi Arab, Bedouin is again second, Yemenite Jewish is again third, and the true Yemeni Arab source comes fourth, behind a Jewish population that had nothing to do with building the target.
And then the result that decides the matter: the two rankings are identical. Not similar, not broadly comparable. All twelve candidates fall in exactly the same order, in exactly the same positions, whether the layer that was actually injected was Jewish or Arab. Both experiments produce Saudi Arab, Bedouin Negev, Yemenite Jew, Yemeni Arab, Omani Arab, Mehri, Palestinian Arab, Iraqi Jew, Lebanese Arab, Iranian Jew, Sephardic Jew, Ashkenazi Jew. The ladder is a property of the model, not of the data.
What the ladder is actually measuring is how close each candidate happens to sit to the Arabian corner of the map, plus how much African admixture each candidate already carries. It is not measuring who was there. Anybody who ran this model on a real Lemba sample and reported that the best fit was Saudi, or Bedouin, or Yemenite Jewish, would be reporting an artifact with complete sincerity.
There is a further wrinkle that makes the point sharper still. Inject a Yemeni Arab layer at ten percent and ask a Yemenite Jewish pole to explain it, and the pole returns 9.57 percent. An Arab layer read through a Jewish source comes back at 96 percent of its true size. The two are, for this purpose, interchangeable.
This is the same lesson this site reached from the opposite direction in the Caribbean article, where a model that measured indigenous ancestry to within a tenth of a point could not tell a Ceramic Age Caribbean source from an Andean or Amazonian one. The method is excellent at quantity and close to useless at identity. Where the Caribbean case was an academic curiosity, here it is the whole argument.
Seventy-Four Percent of What?
Return now to Soodyall's finding that 73.7 percent of Lemba Y chromosomes are non-African. That number is real and it is large, and the temptation is to read it as meaning the Lemba are about three-quarters Middle Eastern. They are almost certainly nothing of the kind, and the reason is the detail from their own oral tradition quoted at the top of this article: the founders brought no women.
The maternal evidence points the same way. Soodyall's mitochondrial DNA survey, cited by the 2000 study, found no trace of Semitic maternal input in the Lemba at all. Every mother in the founding generation, on this evidence, was a local woman.
A founding population of entirely non-African men and entirely African women produces children who are fifty percent non-African. What happens after that depends on one number: how many wives each subsequent generation takes from outside the community. A patrilineal, endogamous group can hold its Y chromosome pool almost perfectly constant across centuries, because Y chromosomes pass only from Lemba father to Lemba son and no outside men enter. The autosomal genome has no such protection. Every wife taken from a Venda or Pedi or Shona family halves her children's inheritance from the founders.
Twenty-five generations is roughly seven hundred years, which places the founding in the era of Mapungubwe and Great Zimbabwe, when Swahili merchants were coming up the Limpopo and Zambezi to the gold fairs of the plateau. At a ten percent rate of marrying out per generation the founding layer falls from fifty percent to fourteen. At twenty percent it falls to 3.6 percent. At twenty-five percent it falls to 1.8 percent, still comfortably above the model's detection floor but nowhere near what the Y chromosome figure would naively suggest.
This is not a claim about what the Lemba figure is. It is a demonstration that a very high non-African Y chromosome fraction and a low single-digit autosomal fraction are not in tension with each other. They are exactly what a small, endogamous, patrilineal founding group of traders would produce after seven centuries. If a Lemba genome-wide dataset ever appears and shows three or four percent Middle Eastern ancestry, that will not refute the oral tradition. It will be one of the values the oral tradition predicts.
So What Probably Happened
Put the strands together and a coherent picture emerges, one that is neither the 2000 headline nor the flat debunking that followed it.
Something male and Middle Eastern entered this community in numbers large enough to dominate its paternal ancestry and to survive seven centuries of endogamy at close to 75 percent. That is not in dispute and no serious reading of the data disputes it. The Lemba's own tradition, their clan names (several of which are Arabic, and several of which appear to correspond to place names in the Hadramaut), their name for themselves in Zimbabwe, Mwenye, and their historic role as itinerant metalworkers and traders all point the same way.
The most economical explanation is the one the archaeology of the region has been pointing at for a century. From roughly AD 900 the Swahili coast was linked to the southern African interior by a gold and ivory trade that ran from Sofala and the Mozambican ports up the Zambezi and Limpopo to Mapungubwe and later Great Zimbabwe. The traders working that network were exactly the population the 2023 ancient DNA study characterised: coastal Muslim merchant communities of mixed African and southwest Asian descent, Persian and then increasingly Arabian in their male lines, African in their female lines. Men from that world settling permanently at inland trading posts, marrying local women and holding together as an endogamous, ritually distinct guild of specialists would produce something very like the Lemba.
Whether any of those men were Jewish is a question the genetics as currently practised simply cannot answer. Jewish merchants were a real and documented presence in the medieval Indian Ocean trade; the Cairo Geniza letters are full of them. So were Yemeni Arabs, Hadhrami Arabs, Persians and Gujaratis, in far greater numbers. The Lemba's practices are compatible with a Jewish origin, with a pre-Islamic south Arabian one, and with an early Islamic one that later shed its Islamic frame, and Lemba communities themselves are divided on the question, with the Zimbabwean Remba more often identifying with an Arab ancestry than their South African relatives.
What can be said with confidence is that no autosomal model, no commercial ancestry test and no coordinate-space calculator will ever settle it, because the sources are 0.03 apart and the question requires resolution the data does not contain. If it is ever settled, it will be settled by a Y chromosome study at the level of full sequencing and named subclades rather than microsatellite motifs, matching Lemba lineages to dated branches of the J1 and J2 trees and asking which specific branch, with which specific coalescence date and geographic distribution, they fall on. That study is technically straightforward and has not been done.
The Wider Lesson
The Lemba story is the most instructive case in the whole lost tribes literature precisely because the underlying signal is real. This is not the Pashtun case or the Igbo case, where the claimed Middle Eastern component largely dissolves on inspection. Here there is something genuinely non-African, genuinely large and genuinely male in the paternal ancestry of a southern African Bantu-speaking population, which is a remarkable historical fact in its own right and deserves to be better known than it is.
What failed was not the detection. What failed was the label. A six-marker motif was given a name, "the Cohen Modal Haplotype", the name was read as an identity rather than as a description of a pattern, and everything downstream followed from that one slippage. The same slippage is happening every day in the reports people pay for and the calculators people run: a cluster gets an ethnic name, the name gets read as certification, and the actual finding, which is usually "your DNA is close to a profile that appears in this historical context", disappears. We wrote about that pattern more generally in Why an Ethnic Label on a DNA Reference Population Can Be Misleading.
The honest summary of forty years of Lemba genetics is short. There is a large, old, male-mediated Middle Eastern component in this population. It most plausibly arrived through the Indian Ocean trading world that connected the Swahili coast to the Zimbabwean plateau. Whether the men who carried it prayed as Jews, as Muslims, or as neither is not a question written in the autosomes, and the marker that once seemed to answer it does not.
Reproduce This Yourself
The coordinates below are the population averages used in every model in this article, in Davidski's scaled Global25 format. Paste them into the source and target panels of Vahaduo or any equivalent tool and the numbers above should reproduce. The four-source model is Cameroonian Bantu, Ju/'hoansi, Dinka and one Middle Eastern population at a time.
Cameroonian_Bantu_(n=50),-0.628099,0.062780,0.019082,0.018069,0.000265,0.011122,-0.015525,0.022517,-0.032953,0.018978,0.003063,-0.003831,-0.000734,0.000790,-0.004186,0.003537,-0.003549,0.001280,-0.001204,0.002261,0.000651,0.000284,-0.000064,0.000181,-0.001379
Ju/'hoansi_(n=22),-0.614231,0.059224,0.018976,0.027470,0.001399,-0.003372,0.240192,-0.187765,0.022739,0.006295,0.002399,-0.058952,-0.020488,0.006831,0.021944,-0.023667,0.034404,0.300298,-0.097610,0.000824,-0.037939,-0.002866,0.004796,-0.004223,0.000054
Dinka_(n=33),-0.577601,0.053054,0.001211,-0.008026,-0.003022,-0.002392,-0.013324,0.015908,0.079653,-0.098794,-0.020397,0.023579,-0.041837,-0.000113,0.008851,-0.017184,0.019648,-0.011905,0.021068,-0.020498,0.000760,0.003432,-0.004037,-0.001807,0.005784
Yemenite_Jew_(n=11),0.051220,0.144944,-0.063905,-0.113345,-0.011862,-0.045966,-0.012498,-0.008056,0.048323,-0.007455,0.012533,-0.026227,0.054086,0.004854,0.003936,0.017164,-0.023197,0.005551,0.005794,0.022886,0.012886,0.016052,-0.006935,0.004995,-0.005683
Yemeni_Arab_(n=8),0.025895,0.135573,-0.060716,-0.105743,-0.010656,-0.041938,-0.012720,-0.007615,0.053764,-0.003303,0.012890,-0.026283,0.051121,0.005023,0.001680,0.015447,-0.017944,0.004767,0.002812,0.019681,0.010887,0.014514,-0.005977,0.006507,-0.003952
Saudi_Arab_(n=246),0.052090,0.140143,-0.060483,-0.111449,-0.010307,-0.045575,-0.012521,-0.008698,0.052667,-0.006099,0.015309,-0.029382,0.058034,0.005754,0.003958,0.023486,-0.022397,0.005200,-0.000856,0.025372,0.010450,0.014695,-0.005302,0.005351,-0.006820
Ashkenazi_Jew_(n=1209),0.099573,0.136334,-0.006897,-0.041084,0.010615,-0.014893,-0.001254,-0.000498,0.007183,0.013714,0.001246,-0.000996,0.001920,0.001106,-0.004853,-0.001634,-0.002482,-0.000930,-0.000132,-0.003591,-0.003471,-0.002983,0.001473,0.002529,0.000055
South_African_Bantu_(n=92),-0.625545,0.063470,0.020205,0.016224,-0.000060,0.010176,0.009510,0.002501,-0.023958,0.011974,0.002595,-0.004698,-0.011182,0.002072,-0.012433,0.008662,-0.007748,0.037998,-0.017473,0.004043,-0.003095,-0.002239,0.002474,-0.000117,-0.000385
Sotho_Lesotho_(n=8),-0.627592,0.061439,0.020082,0.017886,0.000577,0.010912,0.030434,-0.014394,-0.021756,0.013736,0.003086,-0.011109,-0.012190,0.002649,-0.012927,0.006845,-0.005264,0.059749,-0.023788,0.004236,-0.004991,-0.003818,0.002942,-0.000542,-0.001646
Zulu_(low_res)_(n=8),-0.626596,0.068929,0.022156,0.016513,0.000885,0.005369,0.016509,-0.008856,-0.021296,0.009545,-0.002436,-0.005695,-0.015981,0.004920,-0.009025,0.007707,-0.003944,0.045481,-0.020709,0.001704,-0.003790,0.003957,0.007749,-0.001792,-0.000075
Xhosa_(n=15),-0.615479,0.062489,0.019711,0.015569,-0.000164,0.007660,0.029329,-0.014230,-0.017753,0.008468,0.002761,-0.011320,-0.011060,0.002064,-0.008089,0.004146,-0.004277,0.057525,-0.024410,0.003393,-0.004517,-0.001863,0.002473,-0.000651,-0.000375
Swahili_Kenya_Pate_(n=6),-0.280574,0.059408,-0.029855,-0.013189,-0.015644,0.006136,-0.005483,0.008308,-0.001227,-0.008200,-0.001759,-0.005820,0.001883,-0.001330,-0.006379,0.014828,-0.003347,0.002196,-0.002158,0.000688,-0.001830,-0.001195,-0.000349,-0.002048,-0.003872
Swahili_Kenya_Faza_(n=18),-0.323764,0.063414,-0.025141,-0.011054,-0.011575,0.001085,-0.008512,0.011051,0.010487,-0.010357,0.001083,0.000408,-0.000405,-0.002393,-0.005112,0.008324,-0.003187,0.005089,-0.003198,0.001035,0.001643,0.000694,-0.000082,-0.000455,0.000233
Swahili_Kenya_Jomvu_(n=12),-0.492475,0.060932,-0.000566,0.002988,-0.006257,0.007158,-0.010105,0.015192,-0.011419,-0.001837,-0.001259,0.001199,-0.012772,0.000585,-0.016004,0.013149,-0.011963,0.003663,-0.005803,0.005138,-0.001799,-0.002432,0.000965,0.001456,0.001177
References
- Y-DNA Thomas MG, Parfitt T, Weiss DA, et al. Y chromosomes travelling south: the Cohen modal haplotype and the origins of the Lemba, the Black Jews of southern Africa. American Journal of Human Genetics 2000;66(2):674-686.
- Y-DNA Soodyall H. Lemba origins revisited: tracing the ancestry of Y chromosomes in South African and Zimbabwean Lemba. South African Medical Journal 2013;103(12 Suppl 1):1009-1013.
- Y-DNA Spurdle AB, Jenkins T. The origins of the Lemba Black Jews of southern Africa: evidence from p12F2 and other Y-chromosome markers. American Journal of Human Genetics 1996;59(5):1126-1133.
- Y-DNA Hammer MF, Behar DM, Karafet TM, et al. Extended Y chromosome haplotypes resolve multiple and unique lineages of the Jewish priesthood. Human Genetics 2009;126(5):707-717.
- Method Tofanelli S, Taglioli L, Bertoncini S, et al. Mitochondrial and Y chromosome haplotype motifs as diagnostic markers of Jewish ancestry: a reconsideration. Frontiers in Genetics 2014;5:384.
- aDNA Brielle ES, Fleisher J, Wynne-Jones S, et al. Entwined African and Asian genetic roots of medieval peoples of the Swahili coast. Nature 2023;615:866-873.
- Ethnography Parfitt T. Journey to the Vanished City: the Search for a Lost Tribe of Israel. New York: Random House, 1993.
- Ethnography le Roux M. The Lemba: a Lost Tribe of Israel in Southern Africa? Pretoria: UNISA Press, 2003.
- Ethnography Tamarkin N. Genetic Afterlives: Black Jewish Indigeneity in South Africa. Durham: Duke University Press, 2020.
- Data Global25 coordinates by Davidski (Eurogenes). Population averages from the Moriopoulos 2026 collection. Modelling with Vahaduo and scipy NNLS.