
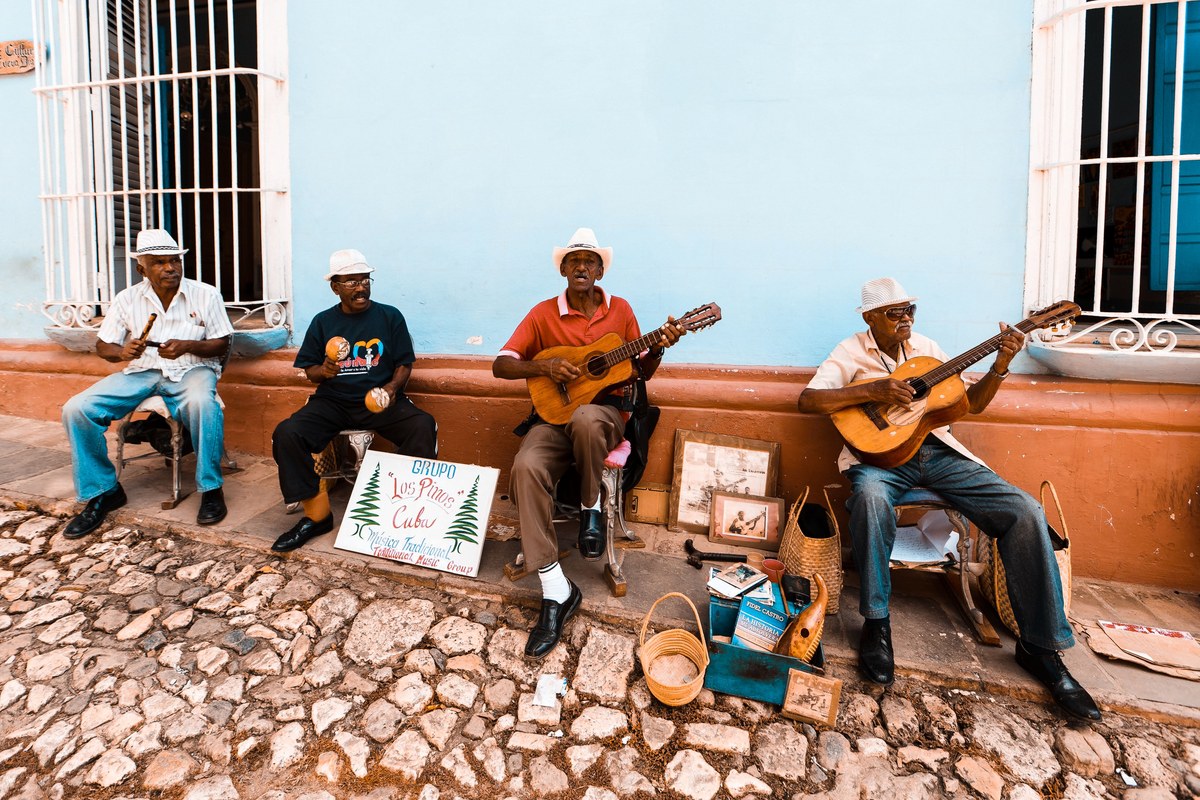
Cuba, Puerto Rico and the Dominican Republic were handed the same three ingredients. Spanish settlers arrived first, an indigenous population was already there and was almost immediately destroyed, and enslaved Africans were brought in to replace the labour that destruction had removed. Three islands, one colonial power, one language, one church. And yet the three populations that came out the other end are not variations on a theme so much as three different answers to the same question. A Dominican carries, on average, roughly nine times more African ancestry than a white Cuban. A Puerto Rican carries roughly twice the indigenous ancestry of either of the other two. The African component is not even drawn from the same part of Africa in all three cases. This article measures those differences in Global25 coordinate space, tests the measuring instrument carefully in both directions, and then asks the more interesting question: why did the same recipe produce three such different results, and what can this kind of modelling actually tell us about each of the three ingredients?
Three Islands, One Recipe, Three Chronologies
The differences are not random, and the history that produced them is well documented. Hispaniola was the first colony and the first sugar economy in the Americas, which means it received the earliest African arrivals anywhere in the hemisphere, onto a European base that was still tiny. Spain then largely abandoned it economically after the 1520s in favour of Mexico and Peru, leaving a small, poor, heavily mixed population that later absorbed continuous gene flow across the border with French, and then Haitian, Saint-Domingue. Cuba went the opposite way. It stayed a lightly settled backwater for two and a half centuries, and only became a sugar island after the Haitian Revolution destroyed its competitor. Roughly 853,000 enslaved Africans were landed in Cuba across the whole trade, and the overwhelming majority of them, about 92 percent, arrived in the last phase between 1801 and 1875. Then, crucially, after abolition Cuba received something neither of the other two islands got on the same scale: something close to a million Spanish immigrants between 1880 and 1930, mostly Galicians, Asturians and Canary Islanders. Puerto Rico sat between the two, with the smallest sugar sector of the three, the most persistent smallholding peasantry in a mountainous interior, and correspondingly the smallest African import.
Those three chronologies predict three different outcomes, and they predict them in a way that can be checked. Cuba should be the most European of the three, because its European inflow is the most recent. Hispaniola should be the most African, because its African inflow is the oldest and its European base was the thinnest for longest. Puerto Rico should retain the most indigenous ancestry, because its interior was the least disrupted by plantation agriculture. All three predictions turn out to be correct, but the sizes of the effects are worth measuring rather than assuming, and one of the three ingredients turns out to be much harder to characterise than the other two.
Who Was Already There
Before measuring what survived, it is worth establishing what the indigenous population actually was, because the popular vocabulary here is misleading. The word Taino is used loosely for every pre-Columbian Caribbean person, but the ancient DNA record separates two quite distinct populations. The first inhabitants, the Archaic Age people who arrived roughly 6,000 years ago and used ground stone rather than pottery, derive from a deeply divergent lineage closest to Central and northern South Americans. From about 2,500 years ago they were replaced, by more than 98 percent according to the peer-reviewed estimate, by a ceramic-using population related to Arawak speakers from the mouth of the Orinoco, who moved up through the Lesser Antilles into the Greater Antilles at least 1,700 years ago. Archaic ancestry survived unmixed only in the far west of Cuba, which is why the earliest Spanish accounts describe the Guanahatabey as speaking a different language from their neighbours.
Ranking the dated pre-contact genomes by distance from Ceramic Age Hispaniola, which at 122 individuals is by a wide margin the largest pre-contact Caribbean sample available, reproduces that picture with unusual clarity.
The Ceramic Age islands are not merely similar, they are almost indistinguishable. The Bahamas sit 0.006 from Hispaniola and Puerto Rico 0.007, distances smaller than those separating neighbouring provinces within most modern European countries, across more than a thousand kilometres of open sea. Saint Lucia and Haiti follow at 0.010 and 0.011, and then modern Arawak-speaking Piapoco and Ceramic Age Venezuela at 0.013, exactly as the Orinoco-origin model requires. Archaic Age Hispaniola sits right out at 0.033, five to six times further than the Ceramic Age islands, sharing its part of the chart with Andean and Amazonian populations rather than with the people who displaced it.
Cuba is the interesting exception, and it is an exception in precisely the direction the archaeology predicted. All three Cuban pre-contact groups, the Ceramic Age at 0.019, the Archaic Age at 0.024 and the mixed Archaic-Ceramic group at 0.025, sit further from the Ceramic Age mainstream than any other island does, and Cuban Archaic and Cuban Ceramic sit only 0.009 apart from each other. The one island where Spanish chroniclers recorded a people speaking a different language is the one island whose pre-contact genomes refuse to collapse into the pan-Caribbean average.
That offset can be quantified rather than merely observed, by modelling every pre-contact group as a mixture of the two things that were actually available: the Ceramic Age population that swept up from the Orinoco, and the Archaic Age population it displaced.
The islands that were fully replaced come out replaced. The Bahamas and Saint Lucia take zero percent Archaic, Puerto Rico takes 1.9, and the modern Arawak-speaking Piapoco and Lokono take zero, which is the control this test needed. Cuba takes 36 to 54 percent depending on which of its sites is modelled, including 38 percent for the Cuban sites classified as Ceramic Age. In other words the ceramic-using population that reached Cuba did not replace the people it found there; it mixed with them, and it did so heavily enough that even Cuba's pottery-making communities carry more than a third of their ancestry from the stone-tool users who preceded them. The 98 percent replacement figure that holds for the Caribbean as a whole does not hold for Cuba, and the Guanahatabey that the chroniclers described as linguistically separate look, on this evidence, like the western remnant of a population that was still substantially present across the island.
Two honest qualifications belong with that chart. The Archaic pole rests on a single genome, and the 26 percent it assigns to Ceramic Age Venezuela is a warning that the pole is partly capturing generic mainland South American ancestry rather than Archaic ancestry specifically. And populations that fit neither pole, such as Andean and Mesoamerican groups, saturate the model at high residuals rather than returning zero; those readings are artifacts and are excluded from the panel. What survives both qualifications is the contrast between Cuba and the other islands, which is large, consistent across all three Cuban site groups, and independently reported in the peer-reviewed literature.
The Recipe, Measured
With the indigenous pole established, the three-way mixture can be modelled directly. The sources are an Iberian pole, the Ceramic Age Hispaniola pole, and two African poles, one West African and one West-Central African, whose separation is discussed further below. Six different Iberian candidates, from Andalusia and Extremadura to Galicia, Portugal and the Canaries, were tested and all return the same answer within about a point, so the largest mainland sample was used. Cuba has no single population-representative sample in this dataset, only samples grouped by the census colour categories Cubans themselves report, so the Cuban figure here is a composite weighted by the 2012 Cuban census shares of 64.1 percent blanco, 26.6 percent mestizo and mulato, and 9.3 percent negro. Afro-Haitians are included as an end-member reference.
The predictions hold, and the spread is very wide. Cuba comes out at 81 percent Iberian, Puerto Rico at 75 percent, and the Dominican Republic at 57 percent, with the African share running the other way from about 13 percent in Cuba and Puerto Rico to 36 percent in the Dominican Republic. The indigenous component does not follow the same gradient at all. Puerto Rico carries 12.9 percent, roughly double the 6.4 percent of Cuba and the 6.5 percent of the Dominican Republic, and that Puerto Rican figure lines up closely with the roughly 14 percent of Ceramic-related ancestry the Fernandes and Sirak study reported for present-day Puerto Ricans using entirely different methods. This is the single most striking number in the comparison. The population whose indigenous inhabitants were declared extinct earliest and most confidently retains the largest measurable indigenous inheritance in the hemisphere outside the mainland.
Does the Instrument Actually Work?
A number like 12.9 percent is only as good as the model that produced it, and this site has argued before that no result of this kind is worth anything without a demonstrated detection floor. Here the floor can be measured directly by mixing a known quantity of the Ceramic Age pole into a real genome that is not itself one of the model's sources, and asking the model to find what was just put there.
The recovery is close to exact. A Portuguese genome on its own returns a baseline of 0.15 percent, and every injected share comes back with that same 0.15 carried through and nothing else added: three percent injected returns 3.14, five returns 5.14, fifteen returns 15.12. Even one percent registers cleanly. This is a far more sensitive probe than the ones used in this site's coverage of the Vandals or the BMAC, and the reason is geometric rather than clever: the three poles here are about as far apart as any three human populations get, with 0.73 between the Iberian and West African poles, 0.70 between Iberian and Ceramic Age Caribbean, and 0.92 between West African and Ceramic Age Caribbean. Compare that with the 0.03 to 0.06 separations that make paleo-Balkan or Iranian-farmer models so treacherous. A three-way model of the Hispanic Caribbean is one of the best-conditioned problems in this entire field.
Sensitivity is only half of it. An instrument that found indigenous ancestry everywhere would be equally useless, so the identical model was run against populations that should have none.
It assigns nothing. Yoruba, Wolof, Afro-Haitians and Afro-Jamaicans come out at a flat zero, the Portuguese at 0.15 percent, Afro-Barbadians at 0.22 and Galicians at 0.39. The one population that breaks the pattern breaks it correctly: African Americans return 1.42 percent, which is not noise but the small, real and independently documented Indigenous American component that population carries. An instrument that recovers a one percent injection, refuses to invent one where none exists, and finds a genuine one percent signal in the one control that should have it, is an instrument whose readings on Cuba, Puerto Rico and Hispaniola can be taken seriously.
What the Model Cannot Do
Having established what the method measures well, it is worth being blunt about what it does not measure at all, because this is where popular ancestry discussion goes wrong most often. The model can tell you how much indigenous ancestry a Puerto Rican carries. It cannot tell you that the ancestry is Taino. Swapping the indigenous pole for eleven different candidates, from Ceramic Age Puerto Rico itself to Archaic Age Cuba to Andean Quechua and Mesoamerican Zapotec, changes almost nothing.
The recovered share moves by 1.4 points across the whole panel, with Guyanese Lokono and Andean Quechua nominally coming out ahead of the actual pre-contact islanders. That ranking should not be read as meaning anything. What it means is that against the enormous Iberian and African contrasts that dominate this model, the differences among Indigenous American populations are simply too small to resolve. The claim that the indigenous ancestry of Puerto Ricans really is Ceramic Age Caribbean rather than generically Amerindian is well supported, but it is supported by local ancestry inference and haplotype masking in the published literature, not by global coordinate modelling of the kind done here. This is a general lesson worth carrying away from the article: this method is excellent at quantity and poor at identity, and a great deal of confident ancestry folklore consists of reading a percentage as though it were a name.
Which Europe? Corsicans, Frenchmen and the Canary Islands
Calling the European component Iberian is a convenience, and the historical record does not fully justify it. Three distinct non-Spanish streams reached these islands, and all three are documented in detail.
The first was French and it came in waves out of the collapse of Saint-Domingue. When the Haitian Revolution destroyed the French colony between 1791 and 1804, its planters scattered, and they kept scattering as the fighting spread east: the Haitian invasions of Spanish Santo Domingo in 1801, the siege of 1805 and Boyer's occupation from 1822 each pushed another cohort out. Cuba took them into its eastern provinces, where they founded the coffee estates around Santiago and Guantanamo. Puerto Rico took them into its western towns, above all Mayaguez, where their sugar and coffee expertise helped turn the island into a serious exporter. A second French stream arrived from an unexpected direction. Napoleon, having lost the army he sent to retake Saint-Domingue, no longer had a use for Louisiana and sold it to the United States in 1803; a portion of the French-speaking Creole and planter population left rather than live under American government, and some of them went to Spanish Puerto Rico and Cuba. The traffic ran both ways, since Spain expelled the French from Cuba in 1809 after Napoleon invaded the Spanish mainland, sending roughly 10,000 Saint-Domingue refugees on from Cuba to New Orleans, and some of those in turn moved on again to the Spanish islands.
The second stream was the deliberate one. The Royal Decree of Graces of 1815 offered free land and eventual naturalisation to any European Catholic willing to swear loyalty to the Crown and the Church, and it worked: hundreds of Corsican, French, Italian, Irish, Scottish and German families settled in Puerto Rico, with the Corsicans concentrating so heavily in the mountain coffee towns of Yauco, Adjuntas, Lares, Utuado and Ponce that Italian surnames are still ordinary there. The third was not European at all: between 1847 and 1874 roughly 141,000 Chinese men were shipped from Guangdong and Fujian to Havana as indentured labourers, of whom about 125,000 arrived alive, and several hundred were later moved on to Puerto Rico.
The question is whether any of that is visible in the genome, and the answer separates cleanly into two halves. The Chinese case is the easy one, because the Han pole sits 0.62 from the Iberian pole and 0.58 from the Ceramic Age Caribbean one, comfortably inside the range this model resolves at the one percent level. Adding it to the four-source model returns 0.18 percent for Cuban mestizos and a flat zero everywhere else, with no improvement in fit anywhere. On this evidence the Chinese contribution to the general Cuban gene pool is below one percent, which is what a cohort of 125,000 men, arriving without women into a population of well over a million, subject to appalling mortality and substantial return migration, would be expected to leave behind. The Chinese Cuban community is a real and important part of the island's history. It is not a measurable part of the island's average genome.
The European half is the hard one, and it is hard for the same reason the indigenous proxies were. Corsica sits 0.038 from the Andalusian pole and Provence 0.029, against the 0.70 to 0.92 that separates the article's three main poles from one another. Offering the model a Corsican source alongside the Iberian one does produce an apparent 10 percent Corsican share for Puerto Rico and a real improvement in fit, which looks at first like a clean confirmation of the Yauco coffee planters. The test that settles it is to offer the model Iberian regional poles on exactly the same terms.
The Corsican reading does not survive. A Canary Islander pole improves the Puerto Rican fit by 18 percent against the Corsican pole's 10, and a Portuguese pole by 12; on the Cuban composite the Portuguese pole improves the fit by 19 percent and the Canarian by 12, against 6 percent for Corsican and 5 for French. Whatever the single-Iberian model was leaving unexplained is explained better by Iberian substructure than by a Corsican or French layer, and that is exactly what the settlement history would predict, since Canary Islanders were the single largest identifiable settler stream to all three islands across the whole colonial period. The apparent Corsican signal is the Andalusian pole being slightly wrong, not a Corsican population being slightly present.
Two things stop this from being a purely negative result. The first is that the model is not simply handing out shares to anybody: German and Irish poles, offered on identical terms, return a flat zero and improve the fit by nothing at all, which is the correct answer for two streams that were real but numerically trivial. The second is that a genuine difference can still be detected when one exists. Injecting a known Corsican layer into the Puerto Rican average and asking the model to recover it works, with errors of one to three points at injections of 10 to 30 percent. So the method can measure a change in Corsican ancestry; what it cannot do is attribute the baseline. A French or Corsican contribution at the few-percent level, which is all the documentary record actually implies, is simply not separable from the Iberian background it sits against. The honest statement is that the European component of all three populations is Iberian in the broad sense, with the Canary Islands the best-fitting single origin, and that any specifically Corsican or French layer is either small or invisible, and this method cannot tell those two apart.
There is one test that would settle it and it cannot be run here, which is worth stating because it is the obvious next step rather than a dead end. The French and Corsican settlement was not spread evenly across Puerto Rico; it was concentrated, in Mayaguez and the west for the Saint-Domingue and Louisiana refugees and in the Yauco highlands for the Corsican coffee planters. A regional comparison, western and highland Puerto Rico against the island average, would test the claim directly, because a genuine settler layer should be geographically patterned while a mis-specified Iberian pole should not be. The dataset used here has only a single undifferentiated Puerto Rican average and no municipal or regional breakdown, so the comparison is unavailable. It is a straightforward prediction, though: if the Corsican layer of Yauco is real and large enough to see, a Yauco sample should carry more of it than a San Juan sample, and the Iberian-substructure explanation offered above predicts no such gradient.
Whose Africa?
The African component behaves differently, because here the sources genuinely can be separated, at least along one axis. Adding a second African pole rather than swapping one for another produces a real improvement in fit: for the Dominican sample the residual falls from 0.024 with a single Yoruba pole to 0.012 with a West African and a West-Central African pole together, a halving that a merely collinear source would not deliver. The resulting split measures position on a West to West-Central African cline, which is the axis along which the transatlantic trade's embarkation regions actually varied.
A within-African estimate drawn from a small African total is unreliable, and this turns out to matter a great deal, so the panel below is restricted to populations whose African share exceeds 50 percent and includes controls whose slave-trade origins are documented in the shipping records.
The controls behave exactly as the archives say they should. Afro-Barbadians, whose ancestors came overwhelmingly through the British trade from the Gold Coast and the Bight of Biafra, sit furthest toward the West African end at 82 percent. Afro-Brazilians, whose ancestors came overwhelmingly through the Portuguese trade from Angola and the Congo, sit at the other end at 24 percent. African Americans sit in between at 59 percent, consistent with a trade that drew substantially from Senegambia as well as from the Bights. An axis that independently reproduces the ordering of the Barbadian, American and Brazilian slave trades from genomes alone is measuring something real.
On that axis, Cuba and Puerto Rico sit close together in the middle, at 41 and 44 percent, which matches the Cuban genome-wide literature's identification of West-Central and Central African populations, alongside the Bight of Biafra, as the best proxy sources for Cuban African ancestry. Hispaniola leans distinctly the other way: Afro-Haitians come out at 27 percent, the second most West-Central-shifted population in the panel. The Dominican sample points the same way but cannot be pinned down, because at 36 percent African it sits below the resolvability threshold, and swapping proxy pairs moves its estimate between 6 and 25 percent. What survives that instability is only the direction: Hispaniola's Africa is more Congo and Angola than Cuba's or Puerto Rico's, and how much more is not a question this method can answer.
That direction deserves a caveat of its own, because the documentary record for the earliest Hispaniola trade points strongly the other way, to Upper Guinea; the first recorded slave rebellion in the Americas, on a Santo Domingo estate in 1522, was led by Wolof captives. The resolution is chronological rather than contradictory. That Senegambian founding stratum is genuinely there in the sixteenth-century record, but it is a small fraction of the total African inflow Hispaniola eventually received, and it has been swamped by later Congo and Angola arrivals and by continuous gene flow with Haiti, whose own African ancestry is the product of the very late, very Congo-heavy French trade. The bulk composition and the founding composition are not the same measurement.
Cuba, Sorted by Social Category
The Cuban samples in this dataset carry something the Puerto Rican and Dominican ones do not: they are grouped by the colour categories Cubans report on the census. Running the identical model across those groups turns the national average into a ladder.
The range is enormous. Cubans reporting as blanco come out 91 percent Iberian; Afro-Cubans come out 39 percent Iberian and 59 percent African. That is a spread of more than fifty points inside one small island with one language and four centuries of shared history, and it corroborates from a completely different angle what the peer-reviewed Cuban survey found when it reported provincial averages ranging from 51 percent European in Santiago de Cuba to 84 percent in Mayabeque, and African shares from 11 percent to 40 percent. The published work described this as substantial population stratification and warned that any medical association study in Cuba has to control for it. The genomes agree, and they add a point the provincial breakdown obscures: the stratification is not only geographical, it tracks a social category people apply to themselves.
One detail in that ladder is worth pausing on. The indigenous component does not rise with the African one; it peaks in the mestizo group at 11.5 percent and is near zero among Afro-Cubans and among those reporting as mulato. Indigenous survival in Cuba was a rural, eastern, peasant phenomenon, concentrated in Granma, Holguin and Las Tunas, and it flowed into the mixed rural population rather than into the plantation one. The three ingredients did not simply blend; they combined in specific pairs, in specific places, for specific historical reasons.
Calibration Against the Published Surveys
All of the above rests on samples uploaded by consumer genomics customers, which is not the same thing as a random sample of a national population, and the way to handle that is to set the results beside the peer-reviewed population surveys rather than to quietly hope nobody checks.
The verdict is mixed in an instructive way. The Dominican result is close to exact: 36 percent African and 6.5 percent indigenous here, against 37 percent and 6 percent in the 2023 study of 1,813 Dominicans in the BioMe biobank. The indigenous estimates for Cuba and Puerto Rico are also close, at 6.4 against 8 percent and 12.9 against 15 percent. But the African estimates for Cuba and Puerto Rico run roughly eight points below the survey figures of 20 and 21 percent. The most likely explanation is simple and is worth stating rather than explaining away: the Cuban and Puerto Rican samples that reach a hobbyist coordinate collection are drawn disproportionately from the European end of each population, whereas the Dominican sample, largely a New York diaspora sample much like BioMe's own, happens to be representative. The rank ordering, the indigenous estimates and the structural conclusions all survive this; the absolute African percentages for Cuba and Puerto Rico should be read as floors rather than as national averages.
The Asymmetry Behind Every One of These Numbers
One more thing has to be said, because every percentage in this article is an average over a process that was violently asymmetric, and the autosomes hide that. The uniparental markers do not. In Cuba, roughly a third of maternal lineages are Native American and 45 percent are African, while the paternal lineages are 80 percent European, 20 percent African and zero percent Native American. In the Dominican Republic, Y chromosomes are 59 percent European or North African and 38 percent African, with Native American lineages at 3 percent, against a maternal record dominated by African and Native American clades. In Puerto Rico, mitochondrial studies have repeatedly found Native American haplogroups in more than half of an unbiased sample, against Y chromosomes that are overwhelmingly European and African.
A figure of six or thirteen percent indigenous autosomal ancestry, then, is the arithmetic residue of a demographic process in which indigenous and African women contributed to the next generation and indigenous men very largely did not. The autosome averages that asymmetry away into a single tidy number. It is the right number for the question this article asks, but it is worth remembering what it is an average of, and that the reason Puerto Rico can be more than half Native American on the maternal line while being 13 percent Native American overall is not a paradox but a description of how these populations were formed.
Limits and Caveats
Several caveats apply and are worth stating plainly. The modern Caribbean averages used here come from the sims-inclusive release of the Moriopoulos collection, because the Dominican average and several of the Cuban colour-category averages are not present in the sims-free release at all; where both releases contain the same population the two averages differ by 0.015 to 0.028, which is small relative to the effects discussed but not negligible, and the Cuban mulato entry rests on a single genome and should be treated as illustrative only. The Cuban national figure is a census-weighted composite built here from three self-identified groups, not a sampled national average, and it inherits whatever sampling bias those three groups carry. The consumer-sample skew described in the calibration section means the African percentages for Cuba and Puerto Rico are underestimates of roughly eight points. The West to West-Central African axis is a single dimension imposed on a genuinely multidimensional African source landscape; its ordering holds across four proxy pairs, but the absolute percentages shift by ten to twenty points depending on which pair is used, which is why the panel excludes every population below 50 percent African ancestry and why the Dominican figure is given as a range rather than a number. The indigenous proxy test in this article is a negative result about resolution, not evidence against a Ceramic Age origin for Caribbean indigenous ancestry, which the published local-ancestry work supports well. The same applies to the Corsican and French test: a null there is a statement about what an Iberian-anchored model can separate, not a claim that those settlers left no descendants, and the documentary record for them is not in doubt. Several of the pre-contact comparanda are thin, with Haiti resting on two genomes, Curacao and Guadeloupe on four each, and Archaic Age Hispaniola on one. The sims concern does not extend to the ancient side of the dataset: rebuilding the Ceramic Age averages for Hispaniola, Puerto Rico and the Bahamas directly from the 108, 17 and 27 individual genomes reproduces the collection averages to within 0.001 to 0.004, so the pre-contact poles used here are sound. And finally, all of the above measures autosomal ancestry proportions only. It cannot speak to cultural continuity, to identity, or to the descendants of Taino communities who maintain that their ancestors never disappeared at all, which is a historical and ethnographic question a coordinate model has no standing to answer.
Conclusion
The three Spanish-speaking Caribbean populations are not three shades of the same thing. They are three different resolutions of the same colonial problem, and the differences among them are legible in their genomes because the timing of each ingredient differed. Cuba is the most European of the three because its largest European inflow arrived last, after abolition, in the great Spanish migration of 1880 to 1930. Hispaniola is the most African because its African inflow came first, onto the thinnest European base, and never stopped. Puerto Rico retains the most indigenous ancestry, close to 13 percent and matching the published estimate from independent methods, because its mountainous interior had the smallest plantation sector to disrupt it. The African component is not even the same Africa in all three cases, with Cuba and Puerto Rico sitting mid-cline and Hispaniola pulled markedly toward the Congo and Angola. The European component, by contrast, refuses to subdivide: the Corsican coffee planters of Yauco and the French refugees of Santiago are documented beyond argument, but against an Iberian background a Canary Islander pole explains the data better than either, and the model cannot separate a small Corsican layer from a slightly mis-specified Spanish one. Inside Cuba, the whole spread of the Caribbean, from 91 percent Iberian to 59 percent African, is reproduced in miniature and sorted by the colour category people report about themselves. And behind all of them sits a pre-contact population so genetically uniform from Guadeloupe to the Bahamas that the islands cannot be told apart, with one exception, Cuba, where more than a third of the ancestry of even the pottery-making communities still traces to the Archaic inhabitants who were never displaced. What a three-way model can do here it does exceptionally well, because the three poles are as far apart as human populations get. What it cannot do is name the indigenous ancestor it counts so accurately, and the gap between those two capabilities is where most of the confident storytelling about Caribbean ancestry lives.
Cuban_Blanco_(n=429),0.0758052,0.1217183,0.0402912,-0.0006343,0.0323289,-0.003897,-0.0186536,-0.0163071,0.0212877,0.025951,-0.0013737,0.0045666,-0.0082187,-0.0076407,0.0067366,-0.0003311,-0.0019169,-0.0009112,-0.0028095,-2.38e-05,0.0018097,-0.0015452,-0.0004637,-0.000576,0.0007072
Cuban_Mestizo_(n=15),-0.0252818,0.078189,0.0435761,0.0089999,0.0186943,-0.0011015,-0.0362255,-0.0387005,0.0114542,0.0225915,0.0001881,0.0037107,-0.0055993,-0.0052399,0.0059265,-0.0007882,-0.0016771,-0.0005727,-0.0024637,-0.0004539,0.0016903,-0.0015249,-0.0001601,-0.0005808,0.0008932
Cuban_Mulato_(n=1),-0.145803,0.116562,0.040593,0.019358,0.030451,0.008833,-0.013021,0.016762,-0.002589,0.02075,-0.002078,0.004581,-0.008281,-0.005249,0.006625,0.003321,-0.004775,-0.000378,-0.000603,0.002526,0.003187,0.00041,0.000246,0.003676,0.00085
Afro-Cuban_(n=7),-0.3230179,0.0896659,0.0287034,0.0087244,0.0174477,0.0053906,-0.0184729,0.0092604,-0.0102256,0.0287777,0.0007521,0.0015269,0.00206,-0.0023071,0.0048437,-0.002152,0.0005819,0.000442,-0.0038216,0.0004141,0.0017093,-0.0023407,0.001106,-0.0003839,0.0006291
Puerto_Rican_(n=1069),0.0088446,0.0784031,0.0444879,0.00927,0.0165745,-0.003893,-0.042546,-0.0449848,0.0130338,0.0227146,-4.53e-05,0.0039802,-0.0064085,-0.0049998,0.0054533,-0.0006641,-0.0009996,-0.0008035,-0.0026358,-0.0002276,0.0015358,-0.0018745,-0.0001539,-0.0008921,0.000744
Afro-Puerto_Rican_(n=12),-0.3217038,0.0669816,0.032802,0.0140983,0.0054018,0.004106,-0.0355862,-0.0097547,-0.0129707,0.0201388,0.0020967,0.0021898,0.0029328,-0.0014984,0.0045026,-0.0029605,6.03e-05,0.0007554,-0.0014667,-0.0017482,-0.0003669,-0.0016016,0.0008004,-0.0008232,-0.0004236
Dominican_(n=123),-0.1624256,0.0886984,0.0353394,0.0084553,0.016528,0.0010158,-0.0228627,-0.0210193,0.0022709,0.0238121,0.0011427,0.0028025,-0.0017703,-0.0036961,0.005235,-0.0013889,-0.0004133,-0.0006425,-0.0028337,-0.0004011,0.0012573,-0.0021846,0.0002241,-0.0006451,0.0007472
Afro-Haitian_(n=31),-0.5333725,0.0839566,0.0235582,0.0151487,0.0085942,0.011265,-0.0099638,0.0229295,-0.029058,0.0253618,0.0038825,0.0023657,0.0082245,-0.0007583,0.005679,-0.0015937,0.0008795,0.0018064,-0.0018189,0.0004465,0.0016548,-0.0016401,0.0008241,0.0013737,0.0003223
Spanish_Andalusia_(Andalusian)_(n=33),0.1079594,0.1455592,0.0363864,-0.0041598,0.0441293,-0.00562,-0.0024568,0.0025173,0.0245056,0.0320128,-0.0020471,0.0063306,-0.0124018,-0.011481,0.0096485,-0.0013219,-0.0057528,-0.0013168,-0.0040375,-0.0014779,0.0026128,-0.0006708,-0.0018263,-0.0039142,0.0012047
Spanish_Extremadura_(Extremaduran)_(n=7),0.1039043,0.1469614,0.0358266,0.0005537,0.0426891,-0.0018326,-0.0021821,0.0008239,0.0238414,0.0314227,-0.0027839,0.0065084,-0.0127426,-0.0144896,0.0073677,-0.002917,-0.006333,-0.0009954,-0.0062491,-0.0004823,0.001836,-0.0047694,-0.0006866,-0.0035116,0.0017451
Spanish_Canarias_(Canarian)_(n=19),0.0812937,0.1457017,0.0302689,-0.012903,0.0378369,-0.0062237,-0.0064936,0.0008137,0.0316044,0.0290523,-0.0004957,0.0052611,-0.0071748,-0.0136175,0.0110221,-0.0021982,-0.0027382,-0.0034873,-0.0108431,0.0009874,0.0006041,-0.0064299,0.0016412,-0.0034183,0.0017017
Spanish_Galicia_(Galician)_(n=19),0.1083716,0.1458086,0.0410465,-0.001088,0.0409955,-0.0003082,-0.0050216,0.0023927,0.0244783,0.0295606,-0.0022991,0.0058447,-0.0124483,-0.0124585,0.010829,0.0006839,-0.0038566,-0.0020803,-0.0046573,-0.0012112,0.0007355,-0.0026358,-0.0009146,-0.0034056,0.0012036
Spanish_Baleares_(Catalan)_(n=5),0.1176824,0.1468118,0.0407316,-0.0013496,0.042137,-0.0008984,-0.0012362,0.0016302,0.0195952,0.0280972,-0.0045888,0.0067878,-0.0133032,-0.0110972,0.0052708,-0.000853,-0.0024282,0.000944,0.001634,-0.002392,0.0006178,0.0017556,-0.0001008,0.0008166,-0.0039916
Basque_Spain_(n=25),0.1254786,0.1489578,0.0544109,0.0085401,0.0541269,0.0005913,-0.0006298,0.0008122,0.0289768,0.0417466,-0.0052874,0.0103828,-0.0249632,-0.0186396,0.0152658,0.0019464,-0.0058464,0.0029797,-0.002137,-0.0031615,0.0083653,0.001647,-0.0070103,-0.0085024,0.0008574
Portuguese_(n=54),0.1043701,0.1448952,0.0371735,-0.003409,0.0422048,-0.0033779,-0.0034019,0.0029971,0.0258392,0.0290406,-0.0023558,0.0062322,-0.0122222,-0.0111966,0.0107996,-0.0015183,-0.0030798,-0.0009679,-0.0043672,-0.0008319,0.0017445,-0.0023203,0.0012529,-0.0018361,-0.0003634
Corsican_(n=14),0.1203273,0.1518216,0.0195294,-0.0230022,0.0350394,-0.0100401,-0.0018464,-0.0005604,0.0157044,0.0337918,-0.0006031,0.0074612,-0.0132308,-0.0071074,-0.004537,-0.0005968,0.0040419,0.0012489,0.0024511,-0.0030461,-0.0003923,0.0002474,-0.0025793,-0.0013858,-0.0005303
French_Occitan_Provence-Alpes-Cote_d'Azur_(n=4),0.120937,0.1442053,0.0354493,0.0043605,0.036699,0.003486,0.0005875,0.000692,0.0127315,0.0224608,-0.0041815,0.0055828,-0.0131565,-0.0118012,0.008211,0.0043425,0.0017928,0.0012668,0.0018855,-0.0028137,-0.0008425,0.0023188,3.1e-05,0.0006625,0.001377
Italian_Tuscany_(Tuscan)_(n=138),0.1195472,0.1494594,0.0148389,-0.0218657,0.0265466,-0.0082475,0.00055,-0.0001856,0.0073392,0.024524,-0.0002906,0.0057916,-0.011393,-0.0048218,-0.0028294,-0.0006755,0.0024234,0.0014634,0.0034476,-0.0034872,-0.0018157,0.0027418,-0.0011218,0.0029695,-0.0009432
German_(n=113),0.1303325,0.137375,0.0581767,0.0389144,0.0394845,0.0157586,0.0043715,0.0061652,0.0037321,0.0009354,-0.0041445,0.002256,-0.0050952,-0.0014932,0.0087965,0.0027128,-0.0036946,0.0016123,0.0037621,0.0013601,0.0030002,0.0017497,0.0003251,0.0084338,0.0002607
Irish_(n=106),0.1334531,0.1344126,0.0616935,0.0491697,0.0376636,0.0193607,0.0031499,0.0046641,0.0036503,0.0026622,-0.0067428,0.0058058,-0.0141729,-0.0138804,0.025808,0.0052983,-0.0106913,0.0018976,0.0009137,0.0018071,0.0049385,0.0015075,0.0006627,0.0145304,0.0008084
Han_Guangdong_(n=16),0.0167888,-0.4500066,-0.0290619,-0.0667399,0.1114631,0.0482133,0.0009841,-0.0062162,-0.0161319,-0.0088498,-0.0151934,-0.0022949,0.0036236,-0.0058232,-0.0029181,-0.0006134,0.0014993,-8.71e-05,-0.0006599,-0.014038,0.0159171,0.0038024,0.0196427,-0.0008511,-0.0019758
Mandinka_Gambia_(n=232),-0.6066183,0.0636149,0.0176093,0.0117575,0.0011673,0.0086961,-0.0363579,0.0369335,-0.0292319,0.0233081,0.0042893,-0.0013075,0.0174727,-0.0011674,0.0140289,-0.0113238,0.0096653,-7.64e-05,-0.0023346,-0.0017649,-0.0009461,-0.0030662,0.0014975,-0.0010652,0.0017121
Wolof_Gambia_(n=112),-0.6045837,0.0652114,0.0176574,0.0080462,0.0006951,0.0074155,-0.0392007,0.0412338,-0.0279796,0.0248183,0.0046324,-0.0012551,0.0187936,-0.0016097,0.0135284,-0.0122941,0.0108114,-0.0021718,-0.0038562,-0.0014862,-0.0024276,-0.0054109,0.0026598,-0.0014341,0.001932
Mende_Sierra_Leone_(n=86),-0.6255241,0.0627502,0.0213819,0.0171678,0.0003793,0.0111978,-0.024993,0.0283137,-0.0409381,0.0293442,0.0054684,-0.0045466,0.0183527,0.0005618,0.0116341,-0.0089113,0.0085538,0.0066732,0.0008755,-0.0012869,0.0002467,0.0004816,-0.0010605,-0.000863,0.000337
Yoruba_Nigeria_(n=38),-0.6300707,0.0637912,0.0216745,0.016422,0.0004616,0.0131593,-0.0447324,0.0475973,-0.0488059,0.0334643,0.0053161,0.0018497,0.024443,0.0013508,0.0128541,-0.0105025,0.0072295,0.0005701,0.0060864,-0.0030969,0.0010804,0.0023722,-0.0013136,-0.0007008,7.56e-05
Cameroonian_Bantu_(n=50),-0.6280987,0.06278,0.0190824,0.0180686,0.0002647,0.0111222,-0.0155249,0.0225174,-0.0329529,0.018978,0.0030626,-0.0038306,-0.0007343,0.0007899,-0.0041856,0.0035375,-0.003549,0.0012796,-0.0012042,0.0022611,0.0006513,0.0002844,-6.4e-05,0.0001808,-0.0013795
Kongo_Republic_of_the_Congo_(n=2),-0.6277345,0.062455,0.0222505,0.0169575,-0.005539,0.011853,-0.016216,0.025153,-0.0358935,0.020957,0.0055215,-0.001274,-0.000149,0,-0.007668,0.007624,-0.004889,-0.00019,0.0006915,0.003377,-0.002558,-0.000309,-0.000185,-0.000602,-0.008143
Dominican_Republic_Ceramic_(n=122),0.0513323,-0.3157964,0.1181006,0.0988487,-0.1122278,-0.0187428,-0.3030483,-0.357893,-0.0118222,-0.0161428,-0.0020565,-0.0009115,0.0008432,0.0251646,-0.0066425,0.0035049,0.0058417,-0.0012326,0.0007748,0.000366,-0.0011435,0.0066813,-0.0026771,-0.0032099,-0.0021015
Puerto_Rico_Ceramic_(n=18),0.0504617,-0.3135164,0.1171589,0.0974204,-0.1124312,-0.0169038,-0.3016102,-0.357857,-0.0128736,-0.0148218,-0.0026883,-0.0009075,-0.0009911,0.0251084,-0.0077888,0.0046406,0.0056862,-0.0016821,0.0018855,-0.0022789,0.0013308,0.0033728,-0.0027182,-0.0035278,-0.0007451
Bahamas_Ceramic_(n=28),0.0511391,-0.3159385,0.116921,0.0997033,-0.1135596,-0.0159864,-0.3040199,-0.3594494,-0.0119646,-0.0145919,-0.0015484,-0.0012096,0.0001646,0.0237792,-0.0073434,0.004527,0.0067334,-0.0021492,0.0011044,-0.0003975,-0.0004813,0.0074147,-0.0011313,-0.0012351,-0.0013685
Cuba_Ceramic_(n=32),0.0495841,-0.3163374,0.1138316,0.0959714,-0.1103475,-0.0204027,-0.2934694,-0.3453751,-0.0110507,-0.0167942,-0.0006343,0.0006228,-0.0009849,0.0236539,-0.0073501,0.0034307,0.0018458,-0.0021221,0.003492,0.005233,-0.0036459,0.0042467,-0.0017794,-0.0033626,-0.0037458
Cuba_Archaic_(n=8),0.0489439,-0.3181146,0.1135606,0.0935489,-0.1114054,-0.0176397,-0.2896505,-0.3436299,-0.0112488,-0.017631,-0.0025982,0.0020419,-0.0017281,0.0235679,-0.0036983,0.002602,0.0002771,-0.0024547,0.0051693,0.0046428,-0.0025579,0.0082075,-0.0013095,-0.0032835,-0.0046253
Cuba_Archaic-Ceramic_(n=17),0.0518229,-0.3149934,0.1150218,0.094601,-0.1100115,-0.0204902,-0.2881645,-0.3412799,-0.0113331,-0.0170337,-0.0025791,0.0005114,-0.0029994,0.0258569,-0.0068419,0.0014819,0.00079,-0.0011105,0.0036749,0.0059074,-0.0042204,0.0053534,-0.0003263,-0.0049686,-0.0026839
Haiti_Ceramic_(n=2),0.0517895,-0.3143065,0.1172845,0.1009375,-0.113098,-0.01757,-0.3056315,-0.3609085,-0.013601,-0.018497,-0.0010555,0.0005245,0.0011895,0.025735,-0.005293,0.0043755,0.005998,0.0032305,0.005405,-0.0001875,0.0023705,0.003153,-0.0046835,0.0010845,-0.002275
Saint_Lucia_Ceramic_(n=10),0.0549765,-0.3154235,0.118001,0.0978691,-0.1104821,-0.0163988,-0.3043154,-0.3610234,-0.0114329,-0.0181689,0.0018025,-0.0004945,0.0017692,0.0223363,-0.0077225,0.0066031,0.0062324,-0.0020904,-0.0003645,-0.000863,0.002745,0.0079508,-0.0036852,-0.0004578,-0.0016404
Guadeloupe_Ceramic_(n=4),0.0537815,-0.3074515,0.1116277,0.1004535,-0.1065582,-0.0206377,-0.30099,-0.3550238,-0.0111465,-0.0202738,-0.0025172,0,0.0008917,0.0205057,-0.0070235,0.0021545,0.0052805,-0.0028825,3.13e-05,-0.0005627,-0.003494,0.0019475,0.0008938,-0.0003012,-0.001766
Curacao_Ceramic_(n=4),0.0546355,-0.3160835,0.1203017,0.0979498,-0.1146367,-0.0204985,-0.2967597,-0.3527737,-0.0137543,-0.0122098,-0.0034505,-0.001611,0.000632,0.0261825,-0.0056665,0.0080545,0.005183,-0.0029138,-0.0051538,-0.0006877,-6.22e-05,0.003957,-0.0046527,-0.0012653,-0.0007185
Venezuela_Ceramic_(n=8),0.0517894,-0.315068,0.1157288,0.0967386,-0.111136,-0.0170823,-0.2957315,-0.3514469,-0.0116579,-0.0146244,-0.0005275,0.001199,0.001561,0.0240325,-0.007838,0.0062649,0.008377,-0.0015361,0.0017599,-0.0001095,0.0031196,0.0046834,0.001895,-0.0021388,-0.0029486
Dominican_Republic_Archaic_(n=1),0.05805,-0.319892,0.11653,0.092378,-0.111405,-0.019243,-0.289533,-0.339217,-0.019634,-0.024237,-0.000487,0.003297,-0.002973,0.021332,-0.010722,0.01127,0.0103,0.001014,0.007416,0.006878,0.00287,0.010881,0.000616,-0.009399,0.000958
Lokono_(n=4),0.0354182,-0.3007273,0.1126782,0.101002,-0.1077382,-0.0120868,-0.2979013,-0.3563637,-0.013582,-0.0149285,-0.0048985,-0.0040395,0.0030752,0.023286,-0.0101205,0.0025838,0.0073688,0.0007543,0.0020895,0.0011653,-0.0022612,0.0065392,-0.001658,0.0013295,0.0025102
Piapoco_(n=5),0.0509928,-0.320298,0.1200752,0.10181,-0.1129442,-0.014837,-0.307394,-0.3656618,-0.0104306,-0.0170938,-0.0047744,0.0006294,0.0012786,0.0251298,-0.0056188,0.0037124,0.0082662,-0.0026098,-0.0004524,-0.0019258,-0.001772,0.0063554,-0.0036974,-0.0023616,-0.004718
Karitiana_(n=14),0.0580499,-0.3202544,0.117985,0.1070984,-0.1128122,-0.0140042,-0.3207056,-0.3790886,-0.0147111,-0.0192261,0.0014498,-0.0020981,-0.0013272,0.0275442,-0.0055354,0.0044323,0.0105146,0.001466,-0.000826,-0.0013489,-0.0062122,0.0117824,-0.0041639,-0.0021689,-0.0071849
Quechua_Peru_(n=21),0.0560442,-0.2902479,0.115794,0.0909476,-0.1065694,-0.0168264,-0.2862765,-0.342601,-0.0129435,-0.0145442,-0.002575,-0.002041,-0.0004531,0.021692,-0.005041,0.0062064,0.0064509,-0.000923,-0.0005149,4.75e-05,-0.002365,0.0048459,-0.0017959,0.0001951,-0.0023836
Zapotec_(n=12),0.055394,-0.2985658,0.1125077,0.0902516,-0.1036347,-0.0188251,-0.2674616,-0.3224481,-0.010925,-0.0157179,-0.0047633,-0.0035345,0.0023413,0.0191639,-0.0067862,0.0015801,0.0029663,-0.0020587,0.0018227,0.0006773,-0.0024957,0.0025966,-0.0006573,-0.000281,-0.002395
African_American_(n=115),-0.4665345,0.0717442,0.0283757,0.0217015,0.0079426,0.012361,-0.0252335,0.0256536,-0.0303083,0.0225028,0.0033434,0.0001735,0.0092072,-0.0018378,0.0092036,-0.0028964,0.0014262,0.0018497,0.0012381,0.0003882,0.0006042,0.0014125,-0.0004617,0.0019244,6.71e-05
Afro-Barbadian_(n=93),-0.5470975,0.0698858,0.0247237,0.0183346,0.004818,0.0126701,-0.0307029,0.033944,-0.0391234,0.0282035,0.0041418,0.0001466,0.0157565,-0.0008746,0.0111671,-0.0065767,0.0050248,0.0023185,0.0031181,-0.0011955,0.0015054,0.0020117,-0.0011662,0.0010352,-0.000358
Afro-Brazilian_(n=16),-0.5410259,0.0653912,0.0255161,0.0147327,0.0029276,0.0083958,-0.0212208,0.0119394,-0.0267559,0.0211175,0.0021927,0.0051848,0.0071922,0.00293,0.0008718,-0.0009877,-1.04e-05,0.002851,-0.0015516,0.0005804,0.0020692,-0.0010675,0.0023625,0.0004937,0.0011626
Afro-Jamaican_(n=46),-0.4863363,0.0857599,0.0277025,0.0205313,0.0104243,0.013141,-0.0175477,0.030126,-0.0299447,0.0237958,0.0032028,-0.0002477,0.0074469,-0.0001593,0.0070243,-0.0012988,0.0003109,0.0023505,-0.0015036,0.0011595,0.0019086,-0.0015385,0.0010453,0.002806,0.0003106
- Fernandes, Sirak et al. A genetic history of the pre-contact Caribbean, Nature, 2021, on the Archaic to Ceramic Age replacement, the Arawakan origin of the Ceramic Age population, the persistence of Archaic ancestry in Cuba, and roughly 14 percent Ceramic-related ancestry in present-day Puerto Ricans and Cubans. nature.com/articles/s41586-020-03053-2
- Moreno-Estrada et al. Reconstructing the Population Genetic History of the Caribbean, PLOS Genetics, 2013, on three-way admixture in Puerto Rico, the African and European clustering of Dominicans, and the two pulses of African migration. journals.plos.org/plosgenetics/1003925
- Marcheco-Teruel et al. Cuba: Exploring the History of Admixture and the Genetic Basis of Pigmentation Using Autosomal and Uniparental Markers, PLOS Genetics, 2014, on the 72, 20 and 8 percent national averages and the provincial range. pmc.ncbi.nlm.nih.gov/articles/PMC4109857
- Fortes-Lima et al. Exploring Cuba's population structure and demographic history using genome-wide data, Scientific Reports, 2018, on 860 Cuban genomes, the Iberian and West-Central African proxy sources, the embarkation regions of the Cuban trade, and the sex-biased admixture pattern. nature.com/articles/s41598-018-29851-3
- Nieves-Colon et al. Ancient DNA Reconstructs the Genetic Legacies of Precontact Puerto Rico Communities, Molecular Biology and Evolution, 2020, on precontact mitochondrial diversity and its survival in living islanders. academic.oup.com/mbe/article/37/3/611
- Bryc et al. Genome-wide patterns of population structure and admixture among Hispanic/Latino populations, PNAS, 2010, on the sex bias in Puerto Rican and Dominican uniparental markers. pnas.org/doi/10.1073/pnas.0914618107
- Martinez-Cruzado et al. Mitochondrial DNA analysis reveals substantial Native American ancestry in Puerto Rico, 2001, on Native American maternal lineage frequencies. pubmed.ncbi.nlm.nih.gov/11512677
- Royal Decree of Graces of 1815 Real Cedula de Gracias, on the recruitment of non-Spanish European Catholic settlers to Puerto Rico and Cuba, and the Corsican settlement of the mountain coffee towns. en.wikipedia.org/wiki/Royal_Decree_of_Graces_of_1815
- Itinerario Chinese Coolies: Hidden Drivers of Nineteenth-Century Cuba's Economic Transformation, on the 141,000 Chinese labourers shipped to Cuba between 1847 and 1874 and the roughly 125,000 who survived the voyage. cambridge.org, Itinerario
- French immigration to Puerto Rico On the Saint-Domingue refugees who settled the western towns including Mayaguez, and the Louisiana Creoles who left after the 1803 purchase rather than live under American rule. en.wikipedia.org/wiki/French_immigration_to_Puerto_Rico
- Davidski Global25 coordinates dataset.
- Vahaduo G25 analysis tool used for NNLS modelling.
- Moriopoulos 2026 collection Aggregated Global25 population averages, including the modern Caribbean averages, the Ceramic Age and Archaic Age pre-contact genomes from Cuba, Hispaniola, Puerto Rico, the Bahamas and the Lesser Antilles, and the African, Iberian and Amerindian reference populations used in this article.