
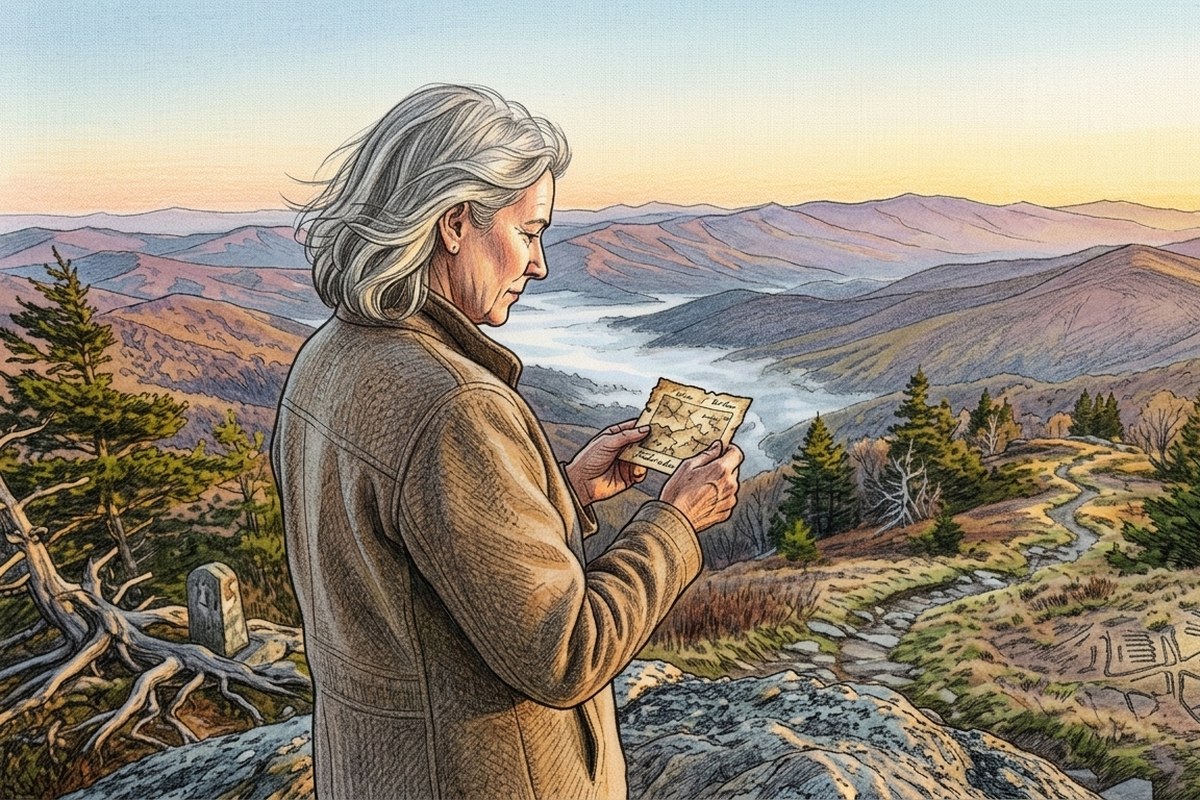
Somewhere in most white American families, and a good many others, there is a story about a Cherokee ancestor, usually a great-grandmother, and very often a princess. It is by a wide margin the most popular ancestral claim in the United States. In the 2010 census, 819,105 Americans reported at least one Cherokee ancestor, more than double the roughly 330,000 people actually enrolled in the three federally recognised Cherokee tribes. The genetics of this claim is unusually clear-cut, and it points in one direction. A genuine Cherokee great-grandmother would leave one of the most conspicuous signals a genome can carry, easily four times larger than the entire genetic gap between an English and a German person. Native American ancestry does not hide. When the DNA of the people who tell this story is actually read, that giant signal is almost never there, and where a small trace of real Native ancestry does turn up in white Americans, it sits in the wrong part of the country and points back not to a great-grandmother but to an ancestor born around the year 1700.
The Most-Claimed Ancestor in America
The scale of the phenomenon is genuinely striking. The number of Americans self-identifying as Cherokee or part-Cherokee rose from 729,533 in 2000 to 819,105 in 2010, making Cherokee by far the most claimed Native American identity in the country, with Navajo a distant second. Against that stand roughly 330,000 enrolled citizens of the three recognised Cherokee tribes as of 2012, the Cherokee Nation, the United Keetoowah Band, and the Eastern Band. The mismatch is not subtle, and Cherokee genealogists have a standing joke about it. As the researcher David Cornsilk put it, the Cherokee are among the best-documented people on earth, coming in third, he said, after royalty and the Mormons, with some thirty separate tribal rolls compiled between 1817 and 1914 and thousands of linear feet of colonial, missionary and federal records tracing Cherokee families back to the mid-1700s. If a family's ancestor was really Cherokee, the paper trail almost always exists. For the overwhelming majority of people who tell the story, it does not.
The specific shape of the myth, a great-grandmother who was a Cherokee princess, is itself a historical artefact rather than a memory. The historian Gregory Smithers has traced its crystallisation to the antebellum South of the 1840s and 1850s, when large numbers of white Southerners began claiming descent from a Cherokee great-grandmother, very often styled a princess. The detail matters, because the Cherokee had no princesses. Cherokee society was matrilineal and organised into seven clans, with no monarchy and no hereditary royalty of the European kind; a child inherited its clan from its mother, and women held considerable political and social authority, including over the adoption of outsiders. The princess is a European romance grafted onto a society that had no place for one. The academic Joel Martin summarised the pattern bluntly, noting that an astonishing number of Southerners assert they have a grandmother or great-grandmother who was some kind of Cherokee, often a princess.
A Grandmother Who Would Light Up the Whole Genome
Here is the part the family stories never reckon with. Native American ancestry is one of the most genetically distinct signals a person of European descent can carry, because Native Americans and Europeans sit at opposite ends of a very deep split in human population history. That distinctness is exactly what makes recent Native ancestry impossible to hide. A single Native ancestor contributes, on average, half her DNA to each child, a quarter to each grandchild, and so on, halving with every generation. A great-grandmother, three generations back, leaves about 12.5 percent; a great-great-grandmother, four generations back, about 6.25 percent.
In G25 coordinate space those are enormous quantities. A person who is 12.5 percent Native American sits about 0.081 units away from a pure English profile, roughly four times the entire distance separating the English average from the German one, which is only 0.020. A 6.25 percent great-great-grandmother still leaves a descendant twice as far from the English cluster as England is from Germany. These are not subtle traces buried in statistical noise; they are the kind of signal that a home DNA test flags on the first pass, and that any admixture model recovers cleanly. The reliable-detection floor of around one percent is not reached until roughly six generations back, meaning a genuine Native ancestor as distant as a four-times-great-grandmother would still register. The claimed great-grandmother sits ten times above that floor. If she existed, the test would find her.
What the Measured Reality Looks Like
She usually does not exist. The largest study of its kind, by Katarzyna Bryc and colleagues at 23andMe and Harvard in 2015, examined the genomes of 148,789 self-identified European Americans and found their average Native American ancestry to be 0.18 percent. Not 12.5 percent, not 6.25 percent, but under one-fifth of one percent, and that is an average pulled upward by the minority who really do carry some. Only about 2.7 percent of European Americans carry as much as one percent Native ancestry at all. The measured average corresponds, arithmetically, to a single Native ancestor about nine generations back, someone born around the year 1700, not a great-grandmother born in the 1800s.
The contrast with the groups around them is telling. The same study found that African Americans average 0.8 percent Native American ancestry, more than four times the European American figure, and that Latinos in the US average 18 percent. The group most attached to the Cherokee story, white Americans, carries the least Native ancestry of any major group in the country by a wide margin. Bryc's team estimated that as many as five million European Americans might carry at least one percent Native ancestry, which sounds like a lot until it is set against the tens of millions who claim a specific Cherokee ancestor. The claim outruns the reality by an order of magnitude.
The Geography Does Not Line Up
The mismatch is not only in the numbers but in the map. If the Cherokee-great-grandmother stories reflected real ancestry, the Native signal in white Americans would be concentrated in the old Cherokee homeland, the southern Appalachians and the Southeast, Georgia, the Carolinas, Tennessee. It is not. Bryc's team found that Native ancestry in self-identified European Americans is concentrated west of the Mississippi, highest in Louisiana, where about eight percent of white residents carry at least one percent, and in scattered western and south-western states at around three percent. The states that most loudly claim the myth, the British-descended heartland of Mississippi, Arkansas and Tennessee where the self-reported American ethnicity and British ancestry both peak, are precisely the states where real Native ancestry in white people is scarcest.
Where real Native ancestry does concentrate in the United States, it tends to sit in populations that make no romantic claim about it at all. African Americans in Oklahoma, the destination of the Cherokee and the other removed tribes after the Trail of Tears, carry the country's highest levels, with more than fourteen percent of them showing at least two percent Native ancestry. The real genetic legacy of Native and settler contact in the American South is written largely into African American genomes and into the mixed populations of the Southwest, not into the white families who tell the Cherokee story.
What Real Native Admixture Looks Like
It helps to see what a genuine, substantial Native American ancestry component looks like when a G25 model is pointed at populations that actually have one. Decomposing a set of admixed American populations into European, Native American and African sources shows a clean gradient, and it shows exactly where the British colonial stock of the white American South falls on it.
Peruvian and Mexican mestizos come out around two-thirds and one-half Native American respectively, Colombians about a third, Puerto Ricans about fifteen percent, all of them carrying a Native signal that is large, unambiguous and easy to model. African Americans register a real if modest 1.4 percent. The English average, standing in for the British colonial stock from which most white Southerners descend, comes out at zero. This is the whole argument in one chart. Real Native ancestry, when it is present, is loud and measurable across an entire continent's worth of admixed populations. In the ancestral pool of the people who claim Cherokee descent most insistently, it is simply absent.
Closer to Home: The Settlers Who Really Did Mix
Not every settler claim of a Native ancestor is a myth, and the clearest way to see the difference is to look just north of the border. French-descended North America was built on genuine, documented intermarriage with Indigenous peoples, and its genomes carry a real, measurable gradient of Native ancestry that stands in exact opposition to the Cherokee case. Modelling the French-Canadian populations against a French base, a Native pole and an African one produces small but non-zero Native shares that rise, sensibly, with the amount of documented intermarriage in each community's history.
The Quebecois average comes out around 0.6 percent Native American in G25, roughly three times the white-American figure and squarely in line with the one percent or so that Moreau and colleagues measured directly from autosomal data in the Quebec founder population. The genealogy behind that number is the mirror image of the Cherokee story. Working from the BALSAC database, the same researchers found that a majority of old-stock Quebecois genuinely descend from at least one Indigenous founder, an Algonquian or Wendat woman who married into the colony in the sixteen hundreds. The ancestor is real, the pedigree is documented, and the genome shows precisely the fraction of a percent that an ancestor eight or nine generations back is expected to leave. This is what a true distant Native ancestor looks like in DNA, not the twelve percent of a great-grandmother, but the honest sliver of a founder from the age of New France.
The Acadians and their Cajun descendants sit a little higher, for a well-documented reason. Acadian settlers on the Atlantic coast intermarried with the Mi'kmaq from the early sixteen hundreds, far more freely than in the St. Lawrence colony where the church and the seigneurial system enforced tighter endogamy. Modelled against an actual Mi'kmaq genome from around 1626, the Maritime Acadian average carries about 0.7 percent Native ancestry and the Louisiana Cajun average about 1.3 percent, reaching above two percent in some individuals, exactly the pattern an earlier analysis on this site found for the same populations, and confirmed even in Cajun paternal lineages that still carry a Mi'kmaq Y chromosome under a French surname. These are small numbers, and the samples here are small too, but the signal is real and it points to a real history.
The Metis stand apart from all of them, because they are not settlers who happen to carry a trace. They are a recognised Indigenous people of Canada, born of sustained unions between French and Scottish fur traders and Cree, Ojibwe and Saulteaux women around the Red River in the seventeen and eighteen hundreds. The eastern Metis sample modelled here carries about ten percent Native ancestry, prairie Red River Metis carry considerably more, and a European-admixed Cree reference sits near seventy percent. The lesson of the whole gradient is the one the Cherokee myth inverts. The difference between a real Native ancestor and an imagined one is never the confidence of the telling; it is whether the marriage actually happened. Where it did, in Quebec, in Acadia, at Red River, the genome records it faithfully at every scale from a founder's sliver to a nation's inheritance. Where it did not, in the Cherokee-great-grandmother heartland of the white American South, the genome is simply silent.
Why Cherokee, and Why a Princess
If the ancestry is mostly fictional, the persistence of the story still demands an explanation, and the historians who study it have supplied a good one. Smithers argues that after the Cherokee were forcibly removed in the 1830s, white Southern opinion recast them, from an inconvenient obstacle to expansion into romantic symbols of noble resistance against federal power. Claiming a Cherokee great-grandmother in the 1850s allowed a white Southerner to assert deep native-born roots in the region and to align himself with a people reimagined as brave anti-federal fighters, a resonance that only deepened after the Civil War, when the defeated Cherokee became a convenient mirror for the Lost Cause. The claim also carried, in Smithers' phrase, a way to authenticate one's American identity while quietly absolving oneself of complicity in what had been done to the tribe. The Cherokee themselves, with their long history of intermarriage, their diaspora across the continent, and their well-documented rolls, offered a more plausible-seeming hook than most other nations.
There is a second, harder function the story sometimes served. Henry Louis Gates has observed that for some families, a Cherokee grandmother offered a more socially tolerable explanation for dark hair, tan skin or other non-European features than the actual source, which in the Jim Crow South was frequently unacknowledged African ancestry produced under slavery. A Cherokee ancestor laundered a family's past in a way that an African one, in that time and place, could not. The recurring folk markers of the myth, high cheekbones, straight dark hair, a swarthy complexion, were pressed into service as evidence for a conclusion that had already been chosen.
A Real Trace Would Still Not Make You Cherokee
One last point needs making, because it cuts against a natural misreading of everything above. Even in the rare case where a white American does carry a genuine, detectable sliver of Native American ancestry, that fraction does not make the person Cherokee, and a DNA test cannot. As the Dakota scholar Kim TallBear has argued at length, Indigenous identity is not a percentage in a genome; it is political citizenship, kinship, culture and lived membership in a community that claims you back. The commercial Native American reference panels cannot even distinguish one North American nation from another with any confidence, so a real trace of Native ancestry says nothing about whether it was Cherokee, Choctaw, Shawnee or anything else. The genetics here can do one thing well, which is to refute a specific claim of a recent Cherokee ancestor when the signal that such an ancestor would necessarily leave is absent. It cannot do the opposite. It cannot make anyone a citizen of a nation, and it was never the tool for that job.
Limits and Caveats
Several caveats apply. No Cherokee or south-eastern United States Native American population is present in the public G25 dataset, a direct consequence of tribal data sovereignty and the Cherokee Nation's non-participation in these projects, so the Native pole in every model here is a proxy, Pima by default, with Maya and Mixe tested alongside it. This turns out not to matter for the argument: all three North American Native references detect an identical 6.25 percent signal in a simulated great-great-grandmother, because at continental scale every Native American reference sits far from Europeans in the same direction, so the lack of a Cherokee-specific sample does not weaken the detectability result at all. The Bryc figures come from 23andMe's local-ancestry pipeline rather than from G25 NNLS, and the two methods are cross-consistent in direction rather than numerically identical. The generational dilution model assumes the additivity of G25 coordinates under admixture, which is the same assumption that underlies all NNLS modelling and is sound on average, though real recombination scatters an individual's realised percentage around the expected fraction, more so at deeper generations. Finally, and most importantly, a detectable Native ancestry fraction is not the same thing as tribal membership, and nothing in this analysis should be read as a test of who is or is not Cherokee.
Conclusion
The Cherokee-princess story is one of the most durable pieces of folklore in American life, and the genetics treats it with an almost unfair clarity. A real Cherokee great-grandmother would be one of the loudest signals in her descendant's genome, larger than the difference between whole European nations, trivially detectable by any test. In the great majority of the families who tell the story, that signal is flatly absent, and the small amount of real Native ancestry that white Americans do carry averages under a fifth of one percent, sits in Louisiana and the West rather than in Appalachia, and traces back to an ancestor born around 1700 rather than to anyone's grandmother. The princess was never real, the great-grandmother almost never was either, and the story endures for reasons that have far more to do with the history of the American South than with anyone's actual ancestry. The DNA can settle the narrow question of the missing grandmother. The larger truth, that being Cherokee was never a matter of blood fractions in the first place, it leaves exactly where it found it.
English_(n=44),0.13136218,0.13746573,0.059919364,0.042702068,0.040035386,0.016289773,0.0040270455,0.00649275,0.00519675,0.0052724091,-0.0059825,0.0053815455,-0.013396295,-0.010696977,0.0197905,0.0070965682,-0.0056569318,0.0024127727,0.0028739773,0.0036721136,0.0057285227,0.0025685227,-0.0018598864,0.012515295,0.00025593182
Scottish_(n=41),0.13153505,0.13422329,0.062280146,0.047536146,0.038566098,0.017359195,0.0035938049,0.0051949268,0.004060561,0.0031557561,-0.0057509024,0.0052343659,-0.012407829,-0.013325878,0.02338361,0.0048023659,-0.0097310732,0.0028428293,0.0024189756,0.002251122,0.0038011707,0.0033657561,-0.00069139024,0.01506822,-0.0011156829
Irish_(n=106),0.13345306,0.13441256,0.061693524,0.049169691,0.037663601,0.019360662,0.003149876,0.0046641294,0.0036502835,0.0026622467,-0.0067427525,0.0058058333,-0.014172869,-0.013880417,0.025807964,0.0052982733,-0.010691293,0.0018975612,0.00091373355,0.001807141,0.0049385128,0.001507528,0.0006627143,0.0145304,0.000808434
German_(n=113),0.13033247,0.13737503,0.058176717,0.038914354,0.039484478,0.015758575,0.0043715221,0.0061651504,0.0037320531,0.00093535398,-0.004144531,0.0022559823,-0.0050952389,-0.0014931681,0.0087965398,0.0027128319,-0.0036946106,0.0016122566,0.0037621062,0.0013601416,0.0030001858,0.0017497168,0.00032506195,0.0084337522,0.00026071681
Spanish_Andalusia_(Andalusian)_(n=33),0.10795939,0.14555918,0.036386424,-0.0041598485,0.044129303,-0.0056200303,-0.0024568182,0.002517303,0.024505606,0.032012788,-0.0020470909,0.0063306364,-0.012401788,-0.01148103,0.0096484545,-0.0013219394,-0.0057527576,-0.0013168182,-0.0040375152,-0.0014779091,0.0026128182,-0.00067075758,-0.0018262727,-0.0039141818,0.0012046667
Pima_(n=12),0.05226375,-0.30905933,0.10999367,0.091220583,-0.10753275,-0.01536225,-0.26804917,-0.32242892,-0.011572667,-0.016173583,0,-0.0036341667,0.0051536667,0.019060667,-0.0066840833,0.0084084167,0.00501975,0.003695,0.00427375,-0.0036370833,-0.0021420833,0.00506975,-0.00418025,0.0027111667,0.000958
Maya_(n=10),0.0545212,-0.2966361,0.1117787,0.0922165,-0.1066046,-0.0175421,-0.2792398,-0.3324554,-0.012885,-0.0154538,-0.0008282,-0.000989,0.0013973,0.0185379,-0.0090525,0.0043887,0.0069625,-0.0012036,-0.0010432,-0.0020384,-0.001959,0.0063807,0.0018488,-0.0008675,-0.0009219
Mixe_(n=12),0.055204167,-0.31853783,0.12121283,0.094746667,-0.10848183,-0.015083333,-0.27848767,-0.33490908,-0.01279975,-0.01429025,-0.0060760833,-0.0046583333,0.0012140833,0.019003333,-0.0074986667,0.0043421667,0.00402025,0.00050683333,0.00084833333,-0.0015006667,0.00052,0.0057704167,0.0031224167,-0.0019478333,-0.001048
Zapotec_(n=12),0.055394,-0.29856575,0.11250767,0.090251583,-0.10363475,-0.018825083,-0.26746158,-0.32244808,-0.010925,-0.015717917,-0.0047633333,-0.0035345,0.0023413333,0.019163917,-0.0067861667,0.0015800833,0.00296625,-0.0020586667,0.00182275,0.00067733333,-0.0024956667,0.0025965833,-0.00065733333,-0.000281,-0.002395
Mexican_Mestizo_(n=131),0.0515475,-0.073043166,0.068416305,0.038727745,-0.03212346,-0.0094567259,-0.13166541,-0.15206485,0.0040000085,0.0081559631,-0.0014314178,0.0017103402,-0.0033672248,0.0023718223,0.00086573114,0.0031896779,0.0011908253,0.00011797991,-0.00068579994,-0.00038741923,-0.0007691311,-0.0002292657,-0.0011555402,-0.00020132436,0.00099328435
Peruvian_Mestizo_(n=10),0.0719363,-0.1451193,0.086323,0.0585276,-0.0566873,-0.0144744,-0.1916981,-0.2258445,-0.0024338,0.0018951,-0.0005196,0.0016185,-0.003999,0.0121796,0.0006786,0.0031688,-0.0004563,0.0006586,-0.0016091,-0.0022761,0.0008858,0.0001113,-0.0024651,-0.0012169,-0.0013652
Colombian_Mestizo_(n=74),0.04234527,-0.0014409189,0.059049919,0.02615427,-0.0089080676,-0.0076355811,-0.096049419,-0.10718786,0.0084462703,0.016837108,-0.002132973,0.0031148378,-0.0069227703,-0.000057662162,0.0036039189,0.00040495946,-0.00095322973,-0.00024312162,-0.0021113919,-0.0010545405,0.00064243243,0.00025897297,-0.0027680811,-0.002930973,0.00090621622
Puerto_Rican_(n=107),0.017979617,0.071716103,0.043707383,0.0082245794,0.013761411,-0.0056385327,-0.049780019,-0.046698439,0.012913,0.023849869,-0.0016146449,0.0046789907,-0.0070619813,-0.0060370187,0.0072362243,-0.00099365421,-0.0010522065,-0.0014836916,-0.0044464206,-0.00052,0.00082893458,-0.0024176916,-0.00014313084,-0.0035653458,0.000024196262
African_American_(n=115),-0.46653447,0.07174422,0.02837571,0.02170154,0.0079426347,0.012360964,-0.025233478,0.025653559,-0.030308311,0.022502832,0.0033433515,0.00017348523,0.0092071933,-0.0018378297,0.0092036162,-0.0028964323,0.0014262249,0.0018497279,0.0012380715,0.0003882054,0.00060421627,0.0014125319,-0.00046174783,0.0019243694,0.000067099968
Yoruba_Nigeria_(n=38),-0.63007071,0.063791184,0.0216745,0.016422,0.00046160526,0.013159289,-0.044732395,0.047597263,-0.048805947,0.033464316,0.0053161053,0.0018497368,0.024443,0.0013508421,0.012854132,-0.0105025,0.0072295,0.00057013158,0.0060864211,-0.0030968684,0.0010804211,0.0023721842,-0.0013135789,-0.00070078947,0.000075578947
French-Canadian_Quebec_(Quebecois)_(n=3),0.12710255,0.14014304,0.049779884,0.020779693,0.039699579,0.0099470523,-0.000078340333,0.0020768653,0.013907826,0.016279727,-0.0059544517,0.0016484217,-0.011199262,-0.005138076,0.013572196,-0.0058340903,-0.01482042,0.0015624913,0.0025559123,-0.0057112597,-0.002370945,0.002638046,-0.0057925537,0.0036551497,0.003512412
French-Canadian_Maritimes_(Acadian)_(n=3),0.127482,0.13777333,0.049528333,0.024440333,0.042161667,0.005113,0.0015666667,0.0033846667,0.010567,0.0212,-0.0047636667,0.003647,-0.014717333,-0.012615667,0.014702667,0.0084856667,0.00452,0.0019006667,0.0018436667,0.0023343333,0.00033266667,0.0047403333,-0.0021776667,0.0079126667,0.0027543333
French-American_Louisiana_(Cajun)_(n=2),0.1291895,0.13405,0.049026,0.0240635,0.039392,0.010598,0.002585,0.002654,0.0095105,0.0134855,0.000081,0.000899,-0.018434,-0.013143,0.007397,0.008287,0.004042,0.001394,0.005908,0.0095045,0.001622,0.0003095,-0.000185,0.0107845,-0.00006
Canadian_(Metis-Mixed)_Newfoundland_and_Labrador_(n=15),0.12429473,0.0911946,0.0607918,0.0348194,0.023347867,0.0096126,-0.013802933,-0.014614733,0.0059447333,0.0064633333,-0.0039082,0.005635,-0.0122992,-0.0093032,0.015254933,-0.00055686667,-0.0074493333,0.0022973333,0.0037373333,0.0016008,0.0026536,-0.001525,-0.00071473333,0.0103708,0.0032492
Cree_(European-Mixed)_(n=4),0.07227775,-0.217831,0.09786275,0.06742625,-0.078553,-0.0076695,-0.16350875,-0.1929725,-0.00388625,-0.01426,-0.00073075,-0.00217325,0.00159825,0.00144525,-0.007804,0.00430925,0.0073015,0.00069675,0.0062535,0.004377,-0.00252675,-0.00649175,0.000832,0.0059645,0.00191575
Canada_Atholville_400BP_Mi'kmaq_(n=1),0.052359,-0.319892,0.120679,0.091409,-0.10125,0.004183,-0.208689,-0.249682,-0.00225,-0.026789,-0.000974,-0.002548,-0.003717,0.018441,-0.000407,0.021612,0.008996,0.012289,0.00264,-0.00988,-0.006364,-0.01014,-0.009244,0.005422,0.009819
French_(n=64),0.12725066,0.14206298,0.048035763,0.019803939,0.040454594,0.0057259707,0.0028751553,0.0034433537,0.010964412,0.01792176,-0.003531958,0.0069664864,-0.014029829,-0.0092185363,0.011249951,0.0035757718,-0.0015258768,-0.00023754557,0.0011234343,0.00084802532,0.0027821352,0.0018239047,-0.0013037431,0.0059363903,-0.0013490234
- Bryc et al. The Genetic Ancestry of African Americans, Latinos, and European Americans across the United States, American Journal of Human Genetics, 2015. cell.com/ajhg
- Smithers Why Do So Many Americans Think They Have Cherokee Blood?, Slate, 2015; The Cherokee Diaspora, Yale University Press, 2015. slate.com
- Moreau et al. Native American Admixture in the Quebec Founder Population, PLOS ONE, 2013 (BALSAC genealogical and autosomal analysis). journals.plos.org
- TallBear Native American DNA: Tribal Belonging and the False Promise of Genetic Science, University of Minnesota Press, 2013.
- Martin Sacred Revolt and commentary on Cherokee identity claims in the American South, cited in Cherokee descent scholarship.
- US Census Bureau 2000 and 2010 counts of self-identified Cherokee ancestry; tribal enrolment figures, 2012. en.wikipedia.org/wiki/Cherokee_descent
- Gates Commentary on Cherokee ancestry claims and physical-trait explanation in African American families.
- Davidski Global25 coordinates dataset.
- Vahaduo G25 analysis tool used for NNLS modelling.
- Moriopoulos 2026 collection Aggregated Global25 population averages and individual genomes from published studies.