
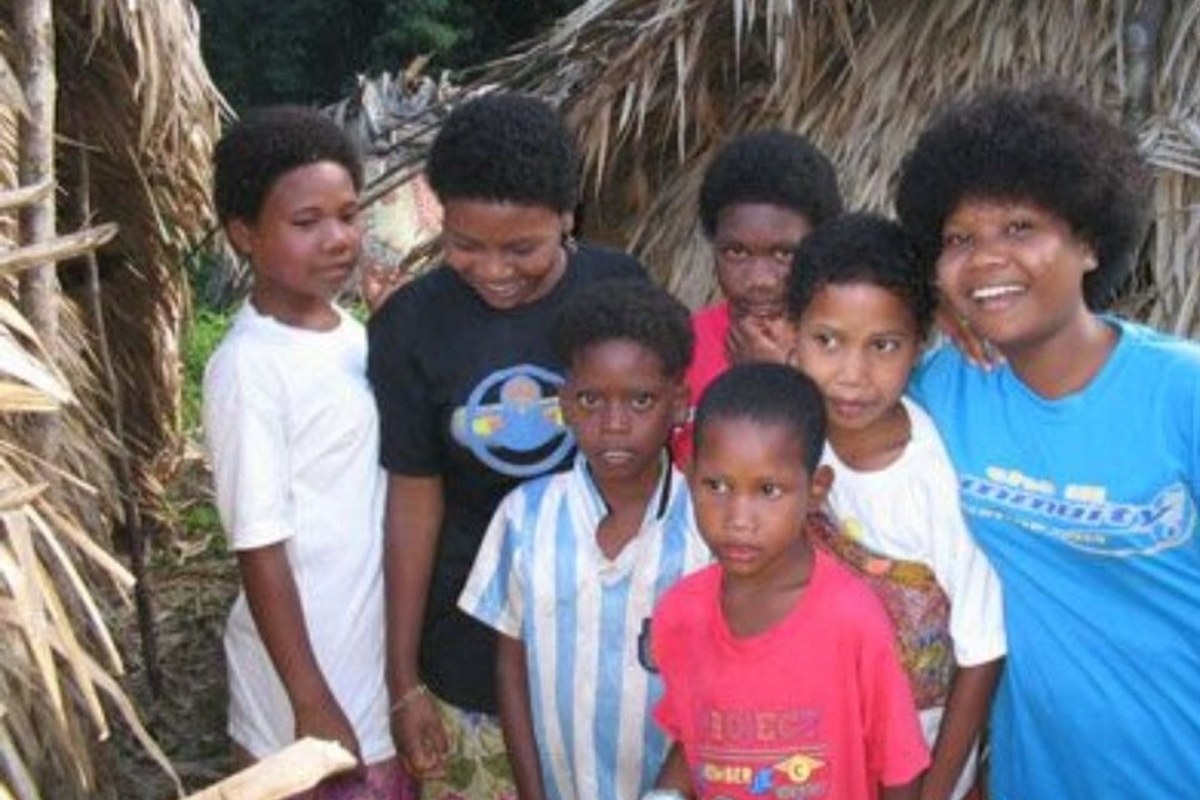
Aeta in Luzon, Semang in the Malay Peninsula, Onge and Jarawa in the Andaman Islands: three groups separated by thousands of kilometres of sea, speaking languages from three different families, and sharing almost no direct contact for tens of thousands of years. Popular and even some older scientific writing has long lumped them together under a single word, Negrito, on the strength of shared traits, short stature, dark skin, tightly curled hair, and treated that word as though it named one ancient race that simply survived in three separate refuges. G25 modelling, read alongside the genomic literature of the last decade, tells a more interesting and more precise story. These are not one population. They are the last visible branches of the very first successful human expansion into South and Southeast Asia, a wave so early that its descendants had already split from each other before most of the ancestors of modern East and Southeast Asians had even arrived in the region, and their shared appearance is convergent, or at most a distant, deep echo of shared ancestry, rather than a sign of a recent common origin.
Basal, Not Bonded: What "First Wave" Actually Means
The genomic picture that has emerged since the mid-2010s places the Andamanese, the Semang and the Philippine Negritos, along with the Papuans and Aboriginal Australians, on the same side of a very old split in the human family tree, the branch that separates the earliest populations to leave the southern coastal route from the later, larger wave that would eventually populate most of mainland East Asia. A neighbour-joining analysis built directly from Negrito genomes found that, following the split from Europeans, the Papuan and Melanesian branch parts ways first, then the Andamanese, Malaysian and Philippine Negrito lineages split off in turn, with all three groups sitting basal to other Southeast and East Asian populations in that order. That branching order matters more than the shared word Negrito does: it means the three groups this article covers did not descend from one another, or from a single unified "Negrito ancestor" that later split three ways. They are parallel survivors of the same broad migratory horizon, not siblings.
The archaeological end of the story is consistent with a genuinely early date. Human occupation at Tabon Cave in Palawan is attested from roughly 40,000 to 50,000 years ago, during a period when lower sea levels joined Borneo, Sumatra, Java and the Malay Peninsula into the single landmass known as Sundaland, with Palawan lying at or just off its northeastern edge. The broader synthesis of the region's population history describes four prehistoric migratory waves shaping Southeast Asia, the first driven by Hoabinhian hunter-gatherers whose closest living genetic relatives are, specifically, the Andamanese Onge and the Malaysian Jehai, two of the three groups at the centre of this piece. Genetic estimates for the initial split between the ancestors of Aboriginal Australians and the rest of this basal group point to a divergence around 40,000 years ago, comfortably inside the same early window.
Genetically Closer to Their East Asian Neighbours Than to Papuans
The clearest test of the "one ancient Negrito race" idea is a straightforward distance ranking. If the Aeta of Luzon were closely and recently related to Papuans or Aboriginal Australians, purely because they look superficially similar, they should sit near them in G25 coordinate space. They do not.
The Aeta's five closest relatives in the whole dataset are, in order, the Agta, Mamanwa and Palawan Batak of the Philippines, and then, at a considerable remove, the Malaysian Semang and Malay islanders, followed by the Filipino national average, all sitting between roughly 0.10 and 0.14 in scaled G25 units. Aboriginal Australians and Papuan Highlanders, the populations Negritos are most often compared to on the basis of appearance, sit four to six times further away, at 0.42 and 0.63 respectively, further from the Aeta than the Aeta are from ordinary lowland Filipinos or Malays. A two-source distal NNLS model built around a generic mainland East Asian pole, represented by the Dai of Yunnan, and a Papuan-related pole, represented by Papuan Highlanders, quantifies the same point directly rather than by proxy.
Every Negrito population modelled here, Aeta, Agta, Batak, Mamanwa, Jehai, Onge, comes out overwhelmingly on the East Asian side of this axis, 74 to 86 percent, with a real but modest 14 to 26 percent Papuan-related pull that is nonetheless several times larger than the 6 percent found in ordinary Malay islanders or the well under 1 percent found in Han Chinese and Vietnamese. That residual is the genuine signature the published literature describes: the Philippine Negrito groups genuinely display a closer affinity to Indigenous New Guineans and Aboriginal Australians than their non-Negrito neighbours do, and Mindanao populations in particular carry a documented, elevated Papuan-related component from a distinct admixture event. It is a real, measurable, and archaeologically sensible signal of shared deep ancestry along the southern coastal route. It is not evidence that the Aeta are, in any meaningful genetic sense, a displaced Papuan population, or that Aeta and Papuan trace to a recent common source separate from the rest of Southeast Asia. On this evidence the two claims that circulate about Negrito ancestry are both partly right and mostly talking past each other: they are basal to, and slightly Papuan-shifted relative to, their non-Negrito neighbours, while still being overwhelmingly closer to those same East and Southeast Asian neighbours than to Papua New Guinea or Australia.
The Semang: Where Hunter-Gatherers Met Farmers, and Neither Side Disappeared
The Semang of the Malay Peninsula, the Jehai, Kintaq, Mendriq and the more distantly related Maniq of southern Thailand, sit at the northern end of the same basal cluster, and their specific genetic formation has been reconstructed directly from ancient genomes rather than inferred from modern samples alone. Whole-genome sequencing of Malaysian indigenous groups found that present-day Malaysian Negritos can be modelled as an admixture of ancient Hoabinhian hunter-gatherers and Neolithic farmers, with the Jehai in particular showing a documented shared genetic drift with the Hoabinhian hunter-gatherer genomes recovered from the region. A two-source NNLS model reproduces that published two-way structure directly, using the actual Malaysia_Hoabinhian ancient genome and a Vietnamese Neolithic farmer from Man Bac as the two poles.
The four Semang groups modelled here, Jehai, Kintaq, Mendriq and Maniq, all fall in a comparatively tight band, 37 to 52 percent Hoabinhian-related ancestry, a real hunter-gatherer signal several multiples larger than the 5 to 8 percent found in neighbouring Malay islanders and Nicobarese populations, who are modelled here as almost entirely descended from the incoming farmer side of the equation. The Maniq of southern Thailand, the most isolated and least-studied of the four groups, come out with the highest Hoabinhian share in this model, 52 percent, consistent with their documented status as the group least reshaped by the later agricultural expansion into the peninsula. What this model does not show is a Semang population untouched by farmers: even the most forager-shifted group here carries a majority-adjacent share from the Neolithic side, a genuine two-way admixture rather than an unmixed relict population, exactly as the original whole-genome study concluded.
The Andaman Islands: What Real Isolation Looks Like in a Coordinate Space
If the Aeta and the Semang show a basal population that nonetheless kept mixing with its neighbours for millennia, the Andaman Islanders show what happens when that mixing essentially stops. Genetic estimates place the settlement of the Andaman archipelago at some point after 26,000 years ago, with the two surviving linguistic branches, Great Andamanese and Onge-Jarawa, diverging from each other roughly 16,000 years ago, and independent Y-chromosome and whole-genome analyses agree that the Onge in particular show unusually little genetic variation, the signature of a population that went through a bottleneck and then developed in isolation for a very long period, with the Onge specifically found to carry full membership in the Ancestral South Indian genetic cluster and no detectable later admixture.
The distance ranking from Onge makes the isolation visible rather than merely asserted. Jarawa sit almost on top of Onge, at a scaled distance of 0.0085, the tightest pairing in this entire dataset, and the historical Great Andamanese sample from 1860 sits nearly as close, at 0.023, confirming that all of the surviving Andaman groups share one recent common origin regardless of the linguistic split between them. After that the distance jumps by roughly an order of magnitude before reaching the closest modern population found anywhere outside the archipelago: Munda speakers of eastern India, at 0.102, ahead of South Indian tribal groups such as Paniya and Irula, which sit further still, at 0.15 to 0.17. That ordering is itself informative. The published literature's claim that the Onge carry a pure, unadmixed Ancestral South Indian signal implies the Andamanese should sit basal to, rather than nested within, the South Asian tribal populations that carry a diluted version of the same deep ancestry; the wide and roughly even gap separating Onge from Munda, Paniya and Irula alike, rather than a close, graded relationship to any one of them, is consistent with that basal position. The Nicobarese, geographically the Andamanese's nearest neighbours today, are genetically far more distant, at 0.25, reflecting their separate and much more recent Austroasiatic-speaking, Southeast-Asian-derived origin. A modern Great Andamanese sample distinct from Onge and Jarawa is not present in this dataset; only the historical, pre-near-extinction 1860 individual is available, so the well documented recent admixture with Indian and East Asian settlers described in the Great Andamanese population since colonial contact cannot be modelled here directly.
Denisovans, and a Number That Does Not Add Up
No discussion of Philippine Negrito ancestry is complete without archaic admixture, and here the published literature is unusually precise. A study analysing archaic ancestry across 118 Philippine ethnic groups found an admixture event into Philippine Negritos from Denisovans independent of the one documented in Papuans, with the Ayta Magbukon subgroup specifically found to carry the highest level of Denisovan ancestry recorded anywhere in the world, between 3 and 9 percent, roughly 30 to 40 percent higher than the share found in Papuans or Aboriginal Australians. That is a real, well replicated, narrowly defined result built from f4-ratio and RD(x) statistics designed specifically to detect archaic introgression.
It is worth trying, and worth being honest about the result of trying, to reproduce a version of that finding directly in G25 coordinate space, using the actual Altai Denisovan genome as a third source alongside the same East Asian and Papuan-related poles used earlier in this piece.
The output does not match the published pattern, and the mismatch is itself the useful result. In this three-source model, Onge returns the largest "Denisova" share of any population tested, 32 percent, nearly double the Aeta's 15 percent and the Jehai's 17 to 18 percent, and far above the low single digits the Ayta Magbukon study actually reports for real Denisovan introgression. That ordering runs directly against the specific literature on this question: the Andaman Islanders are not reported to carry unusually high Denisovan ancestry, and no study has proposed an independent Andamanese-Denisovan admixture event of the kind documented for the Philippines. The likely explanation is a collinearity problem rather than a genuine archaic signal: a single Siberian genome more than 50,000 years old sits at such an extreme distance from every living population that, in an unconstrained NNLS framework, it functions as a generic "most divergent, most bottlenecked" attractor, and the severely bottlenecked, long-isolated Onge, whose entire ancestry has spent tens of thousands of years drifting away from every other lineage in this dataset for reasons that have nothing to do with Denisovans, gets pulled toward it for exactly that reason. The percentages in this chart should be read as an illustration of that collinearity, not as an estimate of Denisovan ancestry in any of these populations; readers wanting an actual figure should look to the f4-ratio and RD(x)-based literature cited above, which is built specifically to separate archaic introgression from ordinary genetic drift and founder effects, a distinction a distance-based coordinate model of this kind cannot reliably make on its own.
Limits and Caveats
Several caveats apply throughout. The Mamanwa, Batak and Malaysia_Hoabinhian samples used here are represented by only one or two individuals each, and their positions should be read as suggestive rather than as precise population averages. Papuan_Highland and Papuan_Coastal are themselves internally structured populations with their own Denisovan admixture history, layered on top of whatever signal they contribute as a proxy source here, so the "Papuan-related" percentages in the second section should be read as a directional pull rather than a literal measure of shared Papuan ancestry. Dai_Yunnan is used as a generic mainland East Asian pole rather than as a literal ancestral source for any of the Southeast Asian groups modelled; it stands in for the broad East Asian-related genetic background against which the deeper, basal signal is measured. The Altai Denisovan genome used in the archaic model is a single, high-coverage individual from a Siberian cave many thousands of kilometres and tens of thousands of years removed from Island Southeast Asia, and, as the previous section discusses at length, its behaviour in an unconstrained coordinate model is better understood as a proxy for extreme genetic drift than as a clean archaic-ancestry detector. Finally, the historical 1860 Great Andamanese sample is a single individual sequenced from a population that was already undergoing severe demographic collapse at the time, and should not be treated as representative of the pre-contact Great Andamanese population as a whole.
Conclusion
The word Negrito describes a shared appearance, short stature, dark skin, tightly curled hair, that recurs in three genetically distinct, independently isolated populations because all three descend from branches of the very first successful human expansion along the southern route into South and Southeast Asia, not because any one of them gave rise to the others. G25 modelling confirms the basal position the published literature assigns to the Aeta, the Semang and the Andamanese alike, and confirms the real, measurable, but modest Papuan-related pull that marks the Philippine groups specifically. It also shows, with unusual clarity, just how different the three groups' subsequent histories were: the Aeta kept enough contact with incoming East Asian-related populations to end up genetically closer to ordinary Filipinos than to Papuans; the Semang absorbed a genuine, roughly even mixture from Neolithic farmers without losing their Hoabinhian signal entirely; and the Andamanese, cut off on their islands, drifted into a degree of isolation so extreme that a single Siberian genome more than 50,000 years old can be mistaken, by a sum-to-one coordinate model, for their nearest genetic relative. That last result is a caution as much as a finding: the same tools that recover real, published patterns of ancestry across most of this article can, at the extremes of genetic isolation, manufacture an archaic-looking signal that the dedicated archaic-ancestry literature shows is not really there.
Aeta_(n=2),-0.016504,-0.3330935,-0.0923945,0.033269,0.104173,-0.006554,0.00235,-0.0139605,0.004704,0.001458,0.0424645,0.0019485,-0.00721,0.001858,0.004682,6.65e-05,0.0086705,0.007158,0.00088,0.003189,0.003369,-0.0179295,-0.006039,-0.0074705,-0.0543665
Agta_(n=2),-0.021057,-0.33157,-0.0956,0.034238,0.104481,-0.0139445,0.0001175,-0.009115,0.0070565,0.0013665,0.0410845,0.004571,-0.00446,-0.0062615,0.003732,0.0002655,0.009453,0.011655,0.0050905,0.0035645,-0.0007485,-0.028193,-0.0115235,-0.0081335,-0.061551
Batak_Palawan_(n=2),-0.0068295,-0.356451,-0.097486,0.01615,0.1161755,0.0004185,-0.0024675,-0.0141915,-0.0052155,-0.0073805,0.0518835,0.0084675,-0.006169,0.0029585,0.0055645,0.0041765,0.0044985,0.004244,0.0072905,-0.0024385,-0.0037435,-0.0212685,-0.0138655,-0.0081335,-0.049277
Mamanwa_(n=1),-0.007968,-0.351373,-0.095034,0.026809,0.118484,-0.022869,0.000235,-0.00923,-0.0045,-0.005285,0.042871,-0.000599,-0.001635,-0.004679,0.001493,0.001326,-0.002868,0.004434,0.00176,-0.004627,0.008485,-0.02337,-0.007148,-0.008555,-0.041433
Jehai_(n=27),-0.0067871852,-0.32786556,-0.10460215,0.028124926,0.096690333,0.035016259,-0.0068935185,-0.0079312593,0.022649111,-0.0010934815,0.063584111,0.0063776667,-0.0088205185,0.008231963,-0.0010858519,-0.004454037,0.0052975185,-0.0035565926,-0.0020530741,0.019078593,-0.011757037,0.010670815,-0.013160148,0.0047170741,0.023204815
Kintaq_(n=15),-0.0044771333,-0.32266753,-0.10328073,0.025990733,0.091381133,0.0298786,-0.0079902,-0.0056306,0.024256467,-0.0002066,0.0574638,0.0070836667,-0.0079483333,0.0082298667,-0.0022982,-0.0079731333,0.0016864,-0.0027535333,-0.0013072667,0.019617733,-0.011704267,0.0083589333,-0.013392933,0.0061050667,0.0237422
Mendriq_(n=11),-0.003725,-0.33032409,-0.10579964,0.024048818,0.093192273,0.035038818,-0.0067936364,-0.0085589091,0.019392364,-0.00092790909,0.062608091,0.0073027273,-0.0089060909,0.0092332727,-0.0027884545,-0.0024107273,0.0018373636,-0.0018772727,-0.00083409091,0.018929636,-0.011865364,0.0090716364,-0.014722636,0.0046114545,0.024298273
Maniq_(n=9),-0.0049322222,-0.30747956,-0.11523133,0.044825222,0.077074444,0.018592778,-0.0055094444,-0.0027434444,0.026542444,0.011177111,0.047742222,0.005212,-0.0092005556,0.0037923333,-0.0072233333,-0.0052888889,0.0074607778,-0.0019707778,-0.0040222222,0.020704444,-0.0075146667,0.0071582222,-0.0089972222,0.010282444,0.022033889
Onge_(n=40),-0.022309375,-0.24349855,-0.131568,0.09481665,0.0296439,-0.003520925,-0.00884805,0.006270925,0.0534217,0.02351755,0.0231769,0.00328585,-0.001661325,0.009502825,-0.01318855,-0.013988225,0.0103069,-0.000877325,-0.00620015,0.0312024,-0.002467525,0.008430025,-0.014737275,0.001578475,0.004316975
Jarawa_(n=19),-0.021866105,-0.24335289,-0.13258763,0.098702105,0.032556579,-0.0048291053,-0.0099816316,0.0065704737,0.054790842,0.024083789,0.023033474,0.0027684211,-0.0038261053,0.010046579,-0.010736105,-0.011430526,0.0099366842,-0.0020403684,-0.0061063684,0.028461,-0.0043146316,0.011343632,-0.012804842,0.0019342632,0.0046511579
Andaman_Islands_100BP_(Great_Andamanese)_(n=1),-0.018212,-0.235603,-0.128598,0.098838,0.023389,-0.003904,-0.016686,-0.003231,0.059721,0.02041,0.023222,0.004646,-0.0055,0.001239,-0.016151,-0.008884,0.009518,0.001014,-0.004902,0.026888,-0.00549,0.011994,-0.013311,-0.001205,0.000958
Nicobarese_(n=6),0.010813167,-0.37388417,-0.0941545,-0.018088,0.1362305,0.0778105,-0.0053661667,-0.007038,-0.0028975,-0.0180415,0.093265167,0.010815333,-0.012908833,0.0060553333,0.0058585,-0.0064306667,-0.0021948333,-0.0045606667,-0.0040851667,0.018112833,-0.0212335,0.014323,-0.013577833,0.0069285,0.040076
Malaysia_Hoabinhian_(n=1),-0.037562,-0.204121,-0.124827,0.093993,0.037853,-0.016455,-0.019036,0.007615,0.044382,0.029887,0.024683,-0.001948,-0.010109,0.009083,-0.026873,0.001724,0.012126,-0.011782,0.000628,0.025387,-0.007112,0.012736,-0.007518,0.020846,0.004431
Vietnam_N_Man_Bac_(n=4),-0.0048375,-0.38717075,-0.065619,-0.02656675,0.141565,0.05284975,-0.001469,-0.01021125,-0.01625975,-0.01444225,0.07555125,0.00382125,-0.00431125,-3.45e-05,0.01333475,-0.01189975,0.00114075,-0.00101375,-0.0051225,0.013788,-0.0044295,0.005039,0.0007705,-0.004097,0.02538675
Dai_Yunnan_Xishuangbanna_(n=101),0.015845079,-0.44240881,-0.041808129,-0.062326208,0.12366055,0.059621941,-0.0018544059,-0.0095022772,-0.018034554,-0.012639238,0.0080341782,-0.00029823762,0.00080512871,-0.0038452178,-0.00079411881,0.0023472376,0.0019531881,-0.0002170297,-0.0026222772,-0.0094710891,0.010968267,0.0071656931,0.012925139,3.3425743e-05,0.0058961485
Papuan_Highland_(n=7),-0.043578,-0.23864957,-0.26172157,0.30791243,0.21032514,-0.516386,0.0019135714,0.005769,-0.043914286,-0.012184,-0.015821286,0.0014987143,0.0014441429,-0.0032242857,0.0019,-0.0024435714,-0.0021047143,-0.00010871429,-0.00012557143,-0.0048595714,0.0017647143,0.0043808571,-0.00047542857,-0.00055085714,0.0049438571
Papuan_Coastal_(n=10),-0.0349438,-0.2604833,-0.2347199,0.2584979,0.1985293,-0.4306351,-0.0019035,0.0029075,-0.0354646,-0.0114444,-0.0065767,0.0019483,0.0038948,-0.002147,0.0009363,-0.0005702,-0.0031943,-0.0026098,-8.78e-05,-0.0039895,0.0009357,-0.0036848,0.0037343,-3.62e-05,-0.0058437
Malay_Malaysia_(n=9),0.014670556,-0.38466,-0.073706111,-0.029213556,0.11550878,0.051966556,-0.0042822222,-0.0088972222,-0.0057493333,-0.0098811111,0.048752667,0.0036133333,-0.0064584444,0.0015902222,0.00374,0.0010755556,-0.00063755556,-0.0013091111,-0.00081,0.0051413333,-0.0064052222,-0.0022256667,-0.0064088889,0.00162,0.0033927778
Han_Beijing_(Northern_China_Profile)_(n=65),0.023342554,-0.44659855,0.0085867385,-0.064078231,0.051057985,0.020972538,0.0052857385,0.0018318769,-0.010628954,0.0035942769,-0.072520231,-0.0088260308,0.011062646,-0.0059325538,-0.0073100769,-0.0010750615,0.00059378462,-0.00013836923,-0.0033494154,-0.0088619077,0.010903923,0.0071072,0.012231831,0.0008916,0.0010224
Altai_UP_Denisova_(n=1),0.07057,-0.011171,0.050157,0.206398,-0.08894,0.059125,-0.062043,-0.06692,-0.029656,-0.078362,0.041734,-0.010191,0.020664,-0.052572,0.025244,0.026916,-0.019949,-0.007348,-0.002011,-0.004627,-0.031445,0.008779,0.018241,0.003494,-0.010059
Munda_(n=5),0.0040976,-0.2250414,-0.1742296,0.1151182,-0.0062778,0.0619694,-0.006627,0.0125072,0.0739556,0.0475272,0.0255274,0.0046458,-0.0040734,0.0181662,-0.0222038,-0.0203922,0.0130906,-0.0022804,-0.0057568,0.0288388,0.0040928,0.0183254,-0.0063596,0.009977,0.0059396
Irula_(n=61),0.01957382,-0.13697989,-0.18285405,0.12614044,-0.05757441,0.05690741,-0.0021381475,0.014802607,0.072890951,0.046774934,4.7901639e-05,-0.00030462295,-0.00080913115,0.008866541,-0.018778393,-0.015256475,0.0081800164,1.6606557e-05,-7.0114754e-05,0.019898918,0.0043529672,0.0060975738,-0.0065907213,0.0037926885,-0.0057222951
Paniya_(n=16),0.0051930625,-0.17536925,-0.18867825,0.1419595,-0.046739375,0.05271025,-0.0069179375,0.017177125,0.091422125,0.05854325,0.0052573125,0.0002903125,-0.003883875,0.015284688,-0.024217687,-0.02994025,0.012582063,-0.0002296875,-0.0033074375,0.030819563,0.00721375,0.014274125,-0.010275813,0.007493375,-0.007918375
- Larena et al. Multiple migrations to the Philippines during the last 50,000 years, PNAS, 2021. pnas.org/doi/10.1073/pnas.2026132118
- Larena et al. Philippine Ayta possess the highest level of Denisovan ancestry in the world, Current Biology, 2021. cell.com/current-biology
- Jinam et al. Discerning the Origins of the Negritos, First Sundaland People: Deep Divergence and Archaic Admixture, Genome Biology and Evolution, 2017. academic.oup.com/gbe
- Aghakhanian et al. / Deng et al. Sequence analyses of Malaysian Indigenous communities reveal historical admixture between Hoabinhian hunter-gatherers and Neolithic farmers, Scientific Reports, 2022. nature.com/articles/s41598-022-17884-8
- Reich et al. / Thangaraj et al. Reconstructing Indian population history, Nature, 2009; South Asia, the Andamanese, and the Genetic Evidence for an Early Human Dispersal out of Africa, American Journal of Human Genetics, 2005. cell.com/ajhg
- McColl et al. The prehistoric peopling of Southeast Asia, Science, 2018.
- Wikipedia contributors Peopling of Southeast Asia; Andamanese peoples; Aeta people; Genetic and anthropology studies on Filipinos. en.wikipedia.org/wiki/Peopling_of_Southeast_Asia
- Davidski Global25 coordinates dataset.
- Vahaduo G25 analysis tool used for NNLS modelling.
- Moriopoulos 2025 collection Aggregated Global25 population averages and individual ancient genomes from published studies.