
From the Pre-Columbian Andes to the Cosmopolitan Río de la Plata, Origins, Migration Waves and the Modern Gene Pool
Argentina is one of the most intense demographic experiments in modern history. In under a century, between 1860 and 1960, more than six million Italians, three and a half million Spaniards, a quarter of a million German speakers, some 170,000 French and a few thousand Welsh settlers landed on its shores, radically reshaping a country that, at independence, barely counted one million inhabitants. Today, Argentines of total or partial European descent represent roughly 90 % of the national population, making Argentina the most genetically Europeanised country in Latin America after Uruguay. Yet beneath this cosmopolitan veneer lies an indigenous Andean substrate concentrated in the north-west and Patagonia, as well as an African component inherited from colonial slavery, smaller than in Brazil or Colombia, but measurable. Population genetics now allows us to decode this mosaic with precision, placing Argentina within a global framework of admixture, migration and identity.
? Key Findings
- The European component dominates the Argentine gene pool at ~80, 85 % nationally, with the combined Italian and Spanish contribution exceeding 75 % of all documented immigration.
- Amerindian ancestry, averaging ~13, 17 % nationally in genomic studies, is strongly concentrated in north-western provinces (Jujuy, Salta) and Patagonia, whereas the 2022 census self-identification stands at 2.9 %, illustrating the gap between cultural assimilation and biological inheritance.
- Sub-Saharan African ancestry remains modest (~2, 4 %) compared to other major Latin American nations, a result of high 19th-century mortality among Afro-Argentines and demographic dilution by mass European immigration.
- Italian immigrants (~6.6 million between 1860 and 1960) constitute the largest single wave, originating chiefly from the Mezzogiorno, Piedmont and Veneto.
- The Welsh colony of Patagonia (founded in 1865) is one of the best-documented cases of diaspora identity preservation anywhere in the world, approximately 50,000 people of Welsh descent live in Chubut province today, and Welsh is still spoken in the Chupat Valley.
- On the G25 PCA, Argentines of predominantly European ancestry cluster close to southern Italians and southern Spaniards, shifted slightly toward Iberian and peninsular Italian sources, a direct reflection of the composition of the immigration flows.
I. Historical Background: From Pre-Columbian Settlement to the Gran Inmigración
Before European contact, the territory of modern Argentina was home to a mosaic of peoples. In the north-west, Andean civilisations, Diaguitas, Atacameños, and communities integrated into the Inca Empire, had developed complex agropastoral societies. In the north-east, Guaraní-speaking horticulturalists occupied the subtropical forests. The central Pampas were home to semi-nomadic equestrian peoples; the south was the domain of the Mapuche, Tehuelche and Selknam. Estimated at perhaps 500,000 individuals before 1492, these populations suffered catastrophic demographic collapse through disease, enslavement and warfare during the colonial period, though their genetic lineages survived, especially in peripheral regions.
The Spanish colonial period (1536, 1816) introduced a first layer of mixing: predominantly male colonists from Castile, Andalusia and the Basque Country formed unions with indigenous women, creating the mestizo phenotype that still characterises a fraction of interior-province populations. Colonial-era African slavery, while more limited than in Brazil, left a detectable mark: in 1810, Afro-Argentines represented up to 30 % of the population of Buenos Aires. The epidemics of the 1870s and the demographic tsunami of European immigration that followed subsequently reduced this community's proportional share to near-invisibility.
The transformative rupture begins after independence (1816). Juan Bautista Alberdi's maxim « Gobernar es poblar » (« To govern is to populate ») became state policy. The 1853 Constitution explicitly guaranteed the rights of immigrants. Between 1860 and 1930, Argentina received approximately 7 million net immigrants, one of the highest densities of immigration relative to host-country population recorded anywhere in the world.
Chronology of Settlement and Immigration in Argentina
~10,000 BCE, 1492 → Spanish colonisation
1536, 1816 → Early European waves
Spaniards, North Italians, 1820, 1870 → Gran Inmigración
South Italians, Spaniards, 1880, 1914 → Second wave
Germans, Syrians, Jews, 1930, 1960
II. The Major Immigration Waves
III. The Amerindian Component: Reading the 2022 Census Map
The map compiled by Piotr Kapucinski from Argentina's 2022 national census illustrates the provincial distribution of the population self-identifying as indigenous or of indigenous descent. The national average stands at 2.9 %, but regional disparities are profound and directly reflect the history of indigenous survival, internal migration and cultural assimilation.
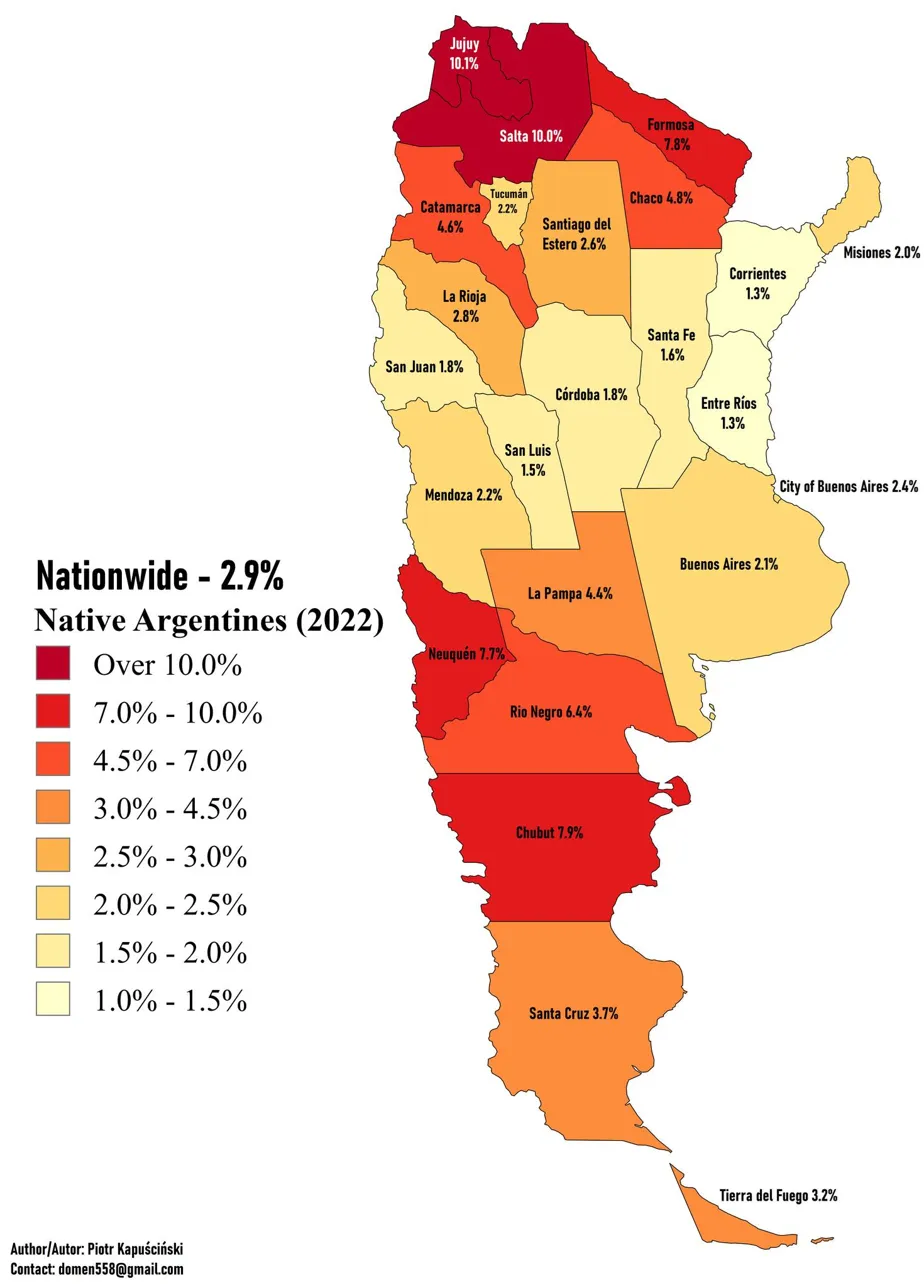
Provincial distribution of Argentines identifying as indigenous (2022 census). Author: Piotr Kapucinski ([email protected]). National average: 2.9 %.
? Methodological Note on the Map
The percentages shown correspond to self-identification as an indigenous community member or descendant, following 2022 Argentine census criteria. These figures substantially underestimate the biologically measurable proportion of Amerindian ancestry: genomic studies place the national average closer to 13, 17 % of total ancestry, with the Amerindian contribution largely transmitted through maternal lineages (mitochondrial DNA). The gap between the 2.9 % census figure and the ~15 % genetic estimate reflects multigenerational cultural assimilation and the social stigma historically attached to indigenous identity in Argentine society.
The north-west (Jujuy at 10.1 %, Salta at 10.0 %) stands clearly apart. These provinces correspond to the core Andean zone, where Quechua, Aymara and Diaguita peoples maintained cultural and demographic continuity despite colonisation, aided by the region's remoteness from the major colonial centres. Patagonia (Chubut 7.9 %, Neuquén 7.7 %, Río Negro 6.4 %) reflects the Mapuche presence, a warrior people who resisted Spanish expansion until the «Conquest of the Desert» (1879) under General Roca, after which surviving Mapuche communities were assigned reservations. Formosa (7.8 %) contains large Qom (Toba) and Wichi communities. By contrast, the Pampean core (Buenos Aires province 2.1 %, Santa Fe 1.6 %) shows the lowest figures: the European immigration wave literally overlaid this zone with a new demographic stratum, making it genetically the most European-dominant region of the country.
IV. Ancestry Composition by Region
The estimates below are derived from NNLS and qpADM modelling reported in the primary literature (Homburger et al. 2015; Morales et al. 2020; Liu et al. 2021; Goldenfeld et al. 2011), cross-referenced against G25 scaled coordinate positioning. Regional variation is substantial, and national averages mask a spectrum ranging from near-purely European (Buenos Aires city) to predominantly mestizo (north-western provinces).
V. Y-Chromosome and mtDNA: The Paternal/Maternal Asymmetry
Uniparental markers tell a striking story of colonial-era asymmetry. During the Spanish colonial period, European men arriving without families formed unions with indigenous women. This created a systematic pattern: Y-chromosomal lineages are predominantly European in modern Argentines, while mitochondrial lineages retain a far higher proportion of Amerindian ancestry. This asymmetry, shared across Latin America, is a molecular fossil of colonialism.
VI. G25 PCA Coordinates for Vahaduo
The three coordinate blocks below allow you to visualise Argentina's genetic position in global and European PCA space within Vahaduo (scaled G25 mode). The first block provides the principal source populations that contributed to the Argentine gene pool. The second offers regional Argentine profiles. The third gives reference Amerindian populations to illustrate the Andean ancestry gradient.
VII. Comparative Overview: Argentina Among Latin American Nations
The table below situates Argentina within the broader Latin American genomic landscape. The contrast between the River Plate nations (Argentina, Uruguay) and the rest of the continent illustrates how immigration policy and demographic history can completely restructure a gene pool within just two or three generations.
| Population | European % | Amerindian % | African % | Dominant Y-DNA | Main European sources |
|---|---|---|---|---|---|
| Argentina (national avg.) | ~80, 85 % | ~13, 17 % | ~2, 4 % | R1b, J2, E1b | Italian, Spanish, German |
| Argentina, Buenos Aires | ~88, 93 % | ~5, 8 % | ~2 % | R1b dominant | Italian (S. & N.), Spanish |
| Argentina, Jujuy / Salta | ~55, 65 % | ~30, 40 % | ~2, 3 % | R1b, Q (Amerindian) | Spanish, Basque |
| Uruguay (national avg.) | ~87, 90 % | ~5 % | ~6 % | R1b dominant | Spanish, Italian |
| Chile (national avg.) | ~52, 57 % | ~38, 44 % | ~2 % | R1b, Q | Spanish, Basque |
| Brazil (national avg.) | ~62, 68 % | ~10 % | ~20, 25 % | R1b, E1b, R1a | Portuguese, Italian, German |
| Mexico (national avg.) | ~48, 52 % | ~45, 50 % | ~3 % | R1b, Q | Spanish |
| Colombia (national avg.) | ~40, 48 % | ~30, 35 % | ~18, 22 % | R1b, E1b, Q | Spanish, Basque |
VIII. Myths and Realities
Common Misconception
“Argentines are genetically identical to Italians or Spaniards, they are essentially transplanted Europeans.”
Genetic Reality
In G25 PCA space, Argentine Euro-mestizos cluster near but distinctly shifted from peninsular Italians and Spaniards. The ~13, 17 % Amerindian component (and ~3 % African) produces a measurable pull away from purely European reference populations. Additionally, the specific mix of South Italian, Galician and Basque sources creates a profile not perfectly matching any single European country.
Common Misconception
“The Welsh colony in Patagonia has been completely absorbed and no longer exists as a distinct genetic group.”
Genetic Reality
The Chubut Welsh community has maintained enough endogamy over 160 years to remain a detectable genomic cluster within Patagonian data. Families bearing surnames like Jones, Evans, Williams or Thomas in the Gaiman and Trelew areas show haplogroup profiles (notably R1b-L21 and I sub-clades) more consistent with British Isles populations than with the Italian/Spanish-dominant Argentine average. Welsh is also still spoken, taught in schools and used in religious services in Y Wladfa.
Common Misconception
“The Afro-Argentine population disappeared entirely due to the yellow fever epidemic of 1871.”
Genetic Reality
The 1871 epidemic did disproportionately affect the poor southern barrios of Buenos Aires where Afro-Argentines were concentrated, and military conscription had already drastically reduced Afro-Argentine men during the Paraguayan War (1864, 1870). However, complete disappearance is a myth: modern genomic surveys detect sub-Saharan African haplogroups L1, L2 and L3 (mtDNA) and E1b (Y-DNA, though partly of North African origin) throughout the Argentine population, ranging from ~2 % to ~6 % in different regions, with higher concentrations in Córdoba and the Litoral provinces.
Common Misconception
“The 2.9 % indigenous figure from the 2022 census accurately reflects the genetic reality of Amerindian ancestry in Argentina.”
Genetic Reality
Self-identification and biological ancestry diverge dramatically. Genomic studies consistently detect Amerindian ancestry in 13, 17 % of the general population at the autosomal level, and in approximately 35 % of maternal mitochondrial lineages. The gap is explained by generations of cultural assimilation: millions of Argentines carry Quechua, Mapuche or Guaraní maternal lineages without identifying as indigenous, because their grandmothers were long since integrated into mestizo society and no longer transmitted indigenous cultural identity.
IX. Key Takeaways
Argentina stands as one of the most dramatic and rapid demographic transformations in recorded history. Within a single century, a sparsely populated post-colonial territory was reconstituted into a largely European-ancestry nation, not through colonisation of an empty land, but through the superimposition of millions of voluntary migrants upon a pre-existing mestizo and indigenous substrate. The result is a gene pool that is uniquely layered: predominantly southern European at its surface, retaining a persistent Andean and Southern Cone Amerindian thread in its maternal lineages, and carrying a residual African legacy that time and assimilation have rendered nearly invisible to census-takers but not to geneticists.
The Piotr Kapucinski map of indigenous self-identification provides a telling proxy for this history: the deep north-west and Patagonia, the regions most distant from the great ports of entry (Buenos Aires, Rosario), preserve the highest concentrations of indigenous identity precisely because the immigrant wave was weakest there. Where the ships docked most thickly, the Pampas, the Litoral, the Cuyo, the European demographic tsunami was most complete, and the indigenous biological inheritance survives today mainly in mitochondrial DNA, invisible to the eye and to the census.
Within the G25 framework, Argentines occupy a liminal position in global PCA space: too European to cluster with Andean mestizos, too shifted by Amerindian and African ancestry to cluster neatly with any European national population. This position is Argentina in miniature, a nation that is, as Jorge Luis Borges observed, «a nation of memory without a landscape to match», and, we may add, a gene pool without a single continental analogue.
References
- Homburger J.R. et al. (2015). Genomic Insights into the Ancestry and Demographic History of South America. PLOS Genetics 11(12): e1005602. DOI:10.1371/journal.pgen.1005602
- Morales J. et al. (2020). Genetic diversity and population structure in Argentina from genome-wide data. BMC Genomics 21: 544. DOI:10.1186/s12864-020-06952-2
- Ramallo V. et al. (2013). Demographic expansion, soft selection, and genetic structure in Latin America. European Journal of Human Genetics 21: 1163, 1169. DOI:10.1038/ejhg.2013.8
- Liu C.C. et al. (2021). Genome-wide study of complex admixture in Latin Americans. Nature Communications 12: 5353. DOI:10.1038/s41467-021-25491-8
- Seldin M.F. et al. (2007). European Population Substructure: Clustering of Northern and Southern Populations. PLOS Genetics 3(9): e143. DOI:10.1371/journal.pgen.0030143
- Santos F.R. et al. (1999). The central Siberian origin for Native American Y chromosomes. American Journal of Human Genetics 64: 619, 628. DOI:10.1086/302236
- Fehren-Schmitz L. et al. (2011). Late pre-Columbian and early colonial population history in the south-central Andes. American Journal of Physical Anthropology 144: 353, 364. DOI:10.1002/ajpa.21414
- Moriopoulos A. (2025). Modern Population Collection, G25 scaled coordinate database. Casperhub & personal compilation. Coordinates cross-validated against Davidski Global25 system.
- Kapucinski P. (2022). Native Argentines by province, 2022 census map. Contact: [email protected].
- INDEC (2022)