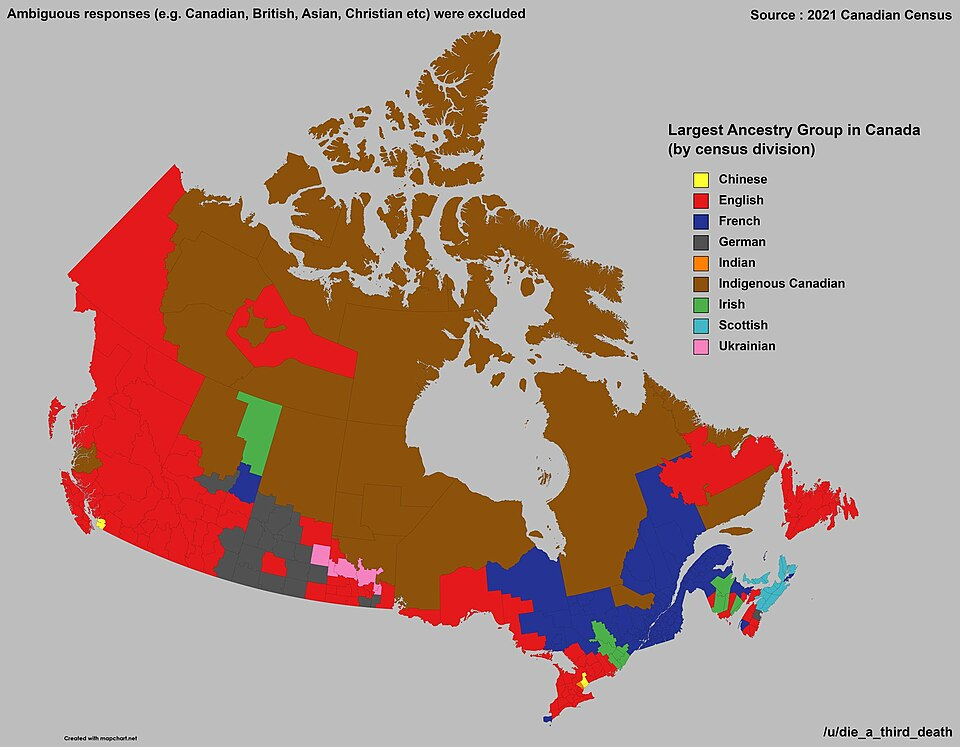
White Americans are not a uniform population. Project the average G25 coordinates of each state onto a PCA of European reference populations and a coherent map emerges: Minnesota plots beside Denmark and Norway, Connecticut and New Jersey drift toward Bergamo and Tuscany, Chicago and Manitoba lean east toward Warsaw and Lviv, Louisiana sits almost on top of northern France, Maine, Vermont and New Hampshire lean unmistakably toward Brittany, and the Deep South, Mountain West and Appalachian states cluster tightly around Welsh, English and Cornish averages. These are not random signals. They are the genetic shadow of three centuries of European immigration, port by port, decade by decade. The largest-ancestry county map of the 2016 US Census and the 2021 Canadian Census ancestry map both anticipate these patterns at the cultural level. G25 PCA simply confirms them at the genome level.
Key Findings
- The white populations of Alabama, Tennessee, Kentucky, Georgia, Texas, Utah and Iowa sit closest to Welsh, English and English_Cornwall in PCA space, reproducing the colonial-era British Isles substrate that dominated the Old Stock South, Appalachia and the Mormon corridor.
- Minnesota, North Dakota and South Dakota are the only US states whose closest European reference populations are Danish, Norwegian and Swedish, the genetic signature of the late-19th-century Scandinavian wave that settled the Upper Midwest.
- Connecticut, Pennsylvania, Illinois, Wisconsin and Michigan all carry a measurable Polish/Slavic component (15-25% in NNLS with a dedicated Polish source), the genetic record of the 1880-1924 "Za chlebem" migration that built the Polonia of Chicago, Detroit, the Pennsylvania anthracite belt and the southern New England industrial cities.
- Manitoba and Saskatchewan show the cleanest Ukrainian-bloc signature in North America, the legacy of the 1891-1914 Galician and Bukovinian homestead settlements between Winnipeg and Edmonton.
- Connecticut, New Jersey, New York, Massachusetts and Rhode Island are pulled south on PC2 toward Italian_Bergamo and Italian_Tuscany, with NNLS estimates of 20 to 32% North Italian-like ancestry, reflecting the 1880-1920 Ellis Island wave from the Mezzogiorno and Northern Italy.
- Louisiana whites are the only US state whose closest European population is French_Pas-de-Calais, with French_Brittany, BelgianC and French_Nord all clustering within a tight radius. The Cajun subset (n=20) sits even further south, almost atop a French-Iberian midpoint. On the G25 PCA, Cajun, Acadian, Louisiana and New Brunswick whites all plot inside the French-Belgian reference cluster rather than the British one.
- Maine, Vermont and New Hampshire all show a real French Atlantic signal on top of an English/Welsh substrate, the genetic trace of Quebec and Acadian migration into the New England mill towns between 1860 and 1920. The signal is strongest in Vermont and Maine (~25% French_Brittany-like in NNLS) and more diluted in New Hampshire (concentrated in Manchester and Berlin but spread across Polish/Greek/German proxies in the state-wide average).
- The Canadian provinces show the same logic in mirror image: Quebec, the Acadian sample and New Brunswick share Louisiana's French shift, while Newfoundland is the most British-baseline population in North America (97% Welsh-like in NNLS).
- The genetic map of European America is not a single melting pot. It is a regionalised mosaic in which colonial founders, 19th-century Catholic and Lutheran labourers, Mediterranean industrial workers and Eastern European refugees each left a distinct, geographically bounded fingerprint that is still measurable today.
1. From Census Categories to Genetic Coordinates
The 2016 American Community Survey and the 2021 Canadian Census let respondents declare their ancestry in their own words. The resulting county-level largest-ancestry maps tell an immediately recognisable story. German is the single largest reported ancestry across the entire Midwest and Great Plains, from western Pennsylvania to eastern Washington. Mexican dominates the Southwest. Irish is the largest reported ancestry across most of the Northeast and Atlantic coast. African American is the modal category through most of the Deep South. "American" appears as the dominant self-identification through Appalachia, Eastern Kentucky, Tennessee and the Ozarks, a marker of deep colonial-era ancestry that respondents no longer trace to a specific European country.
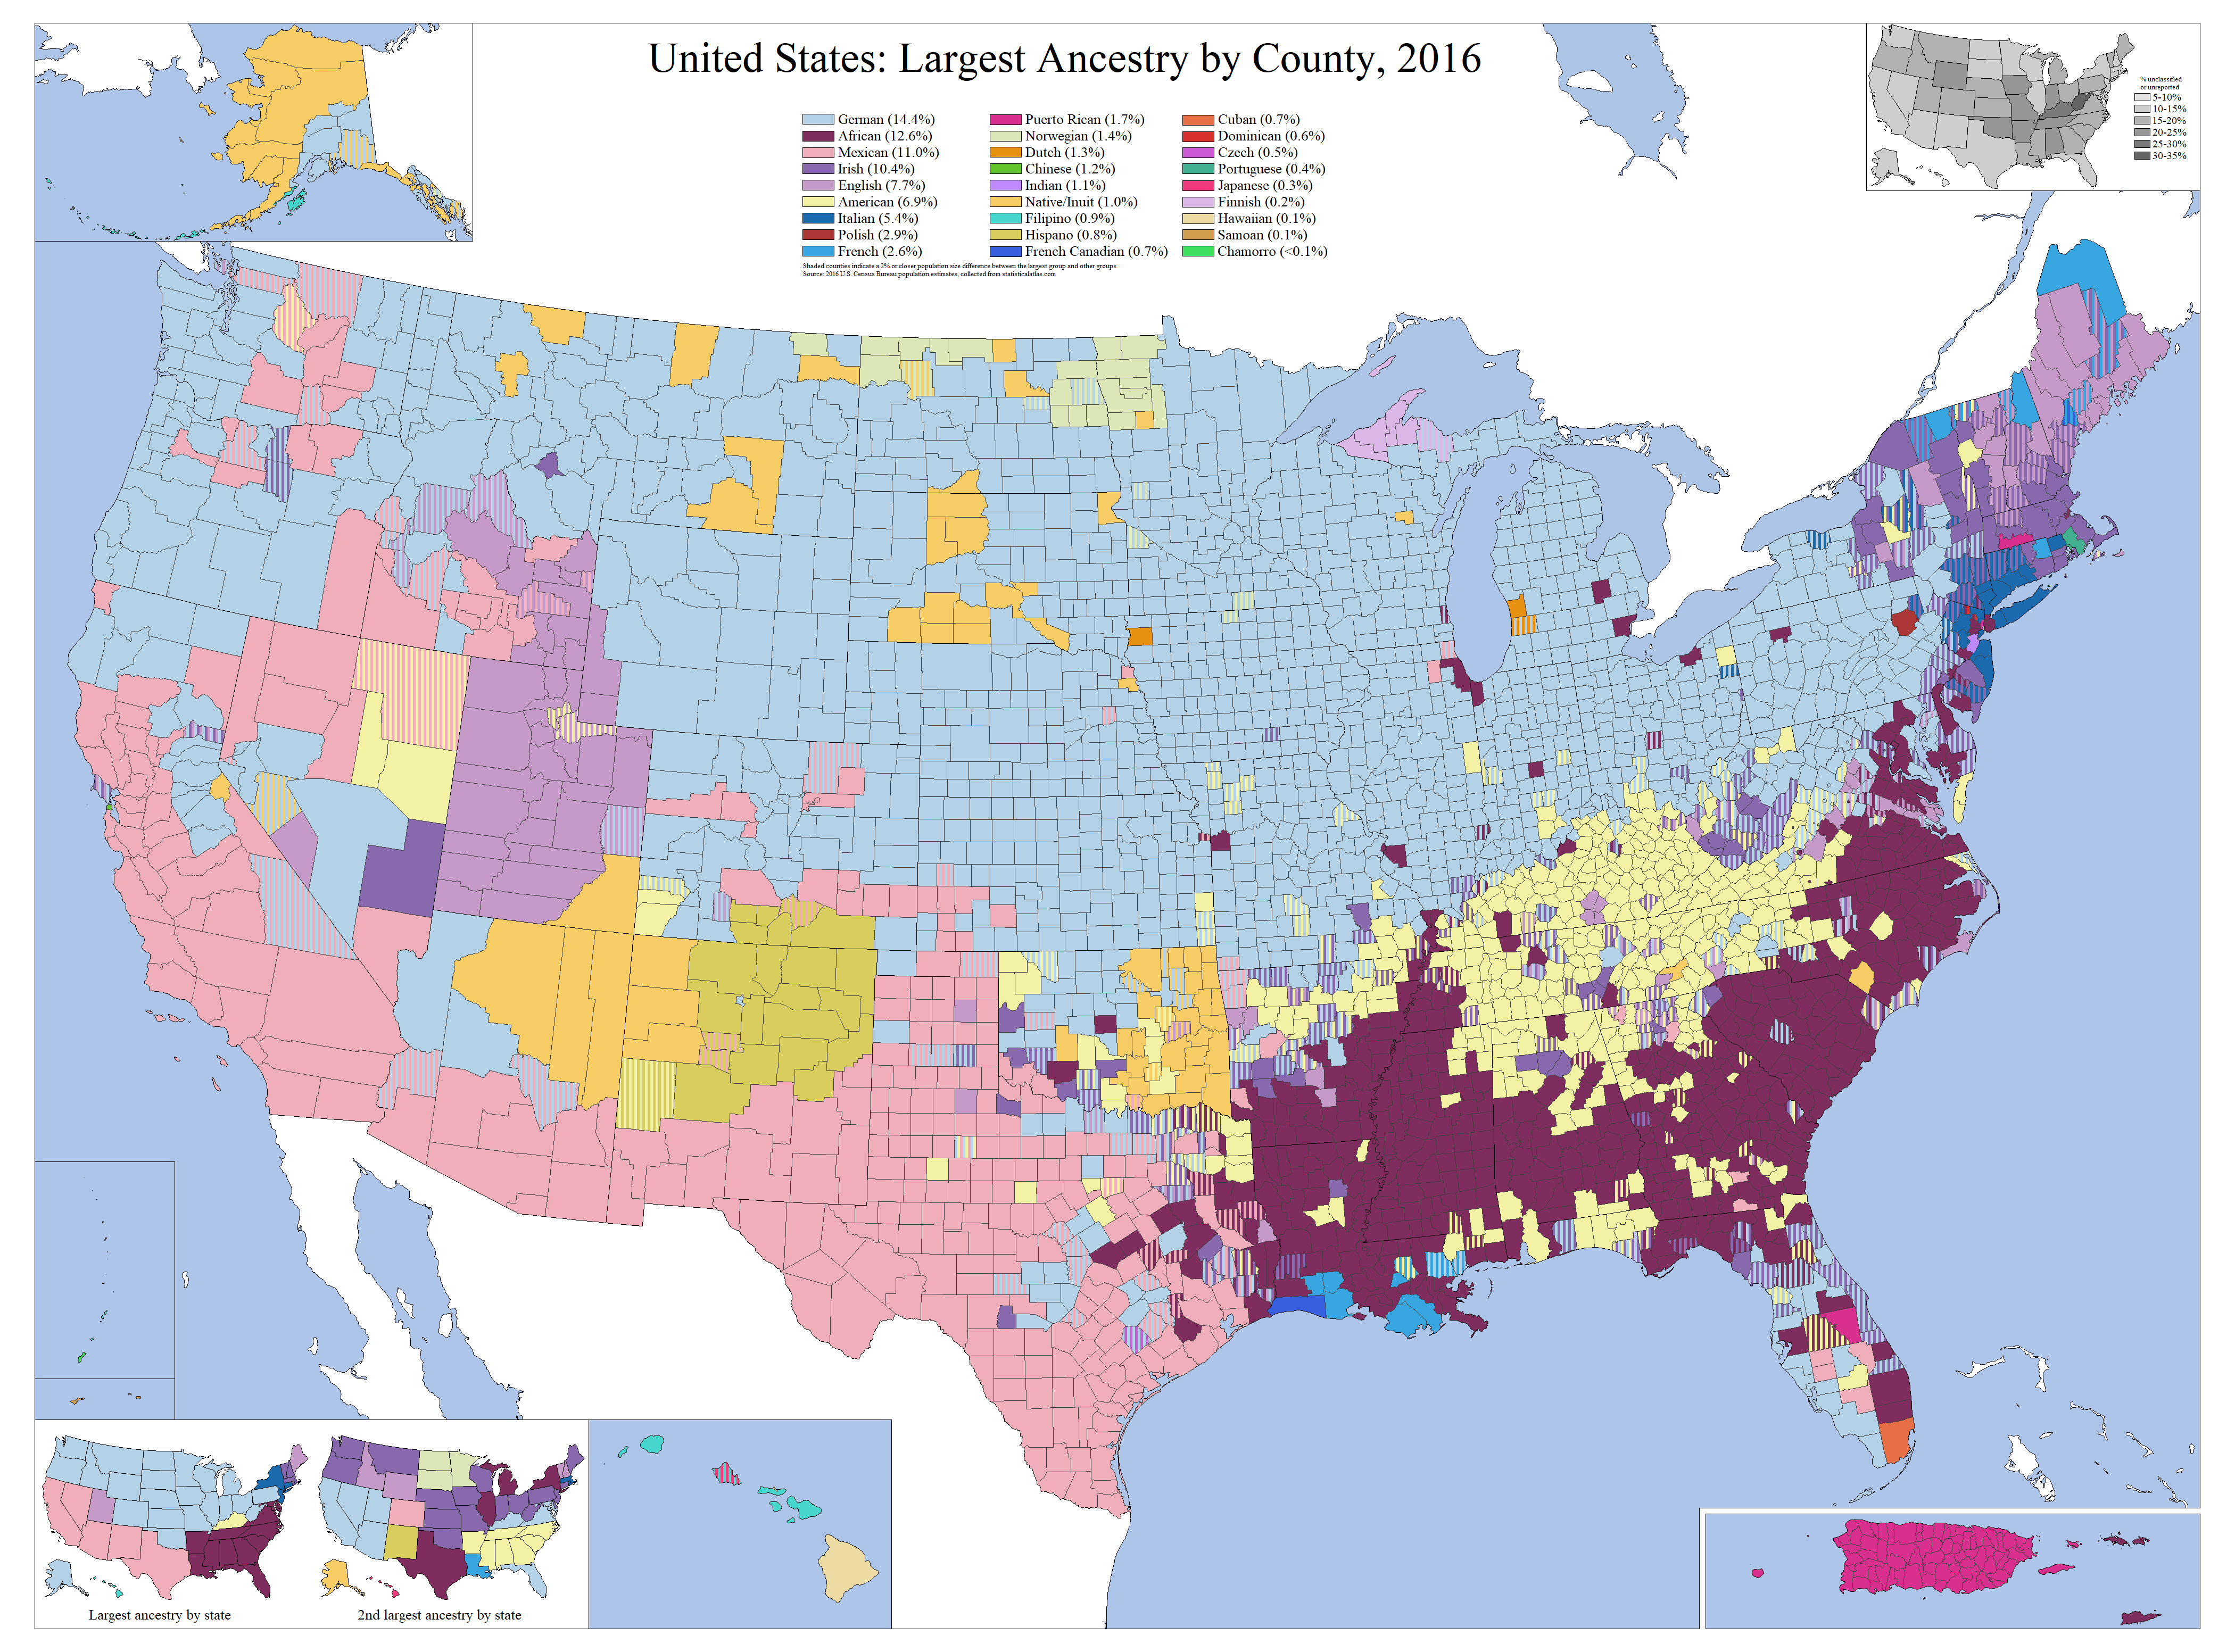
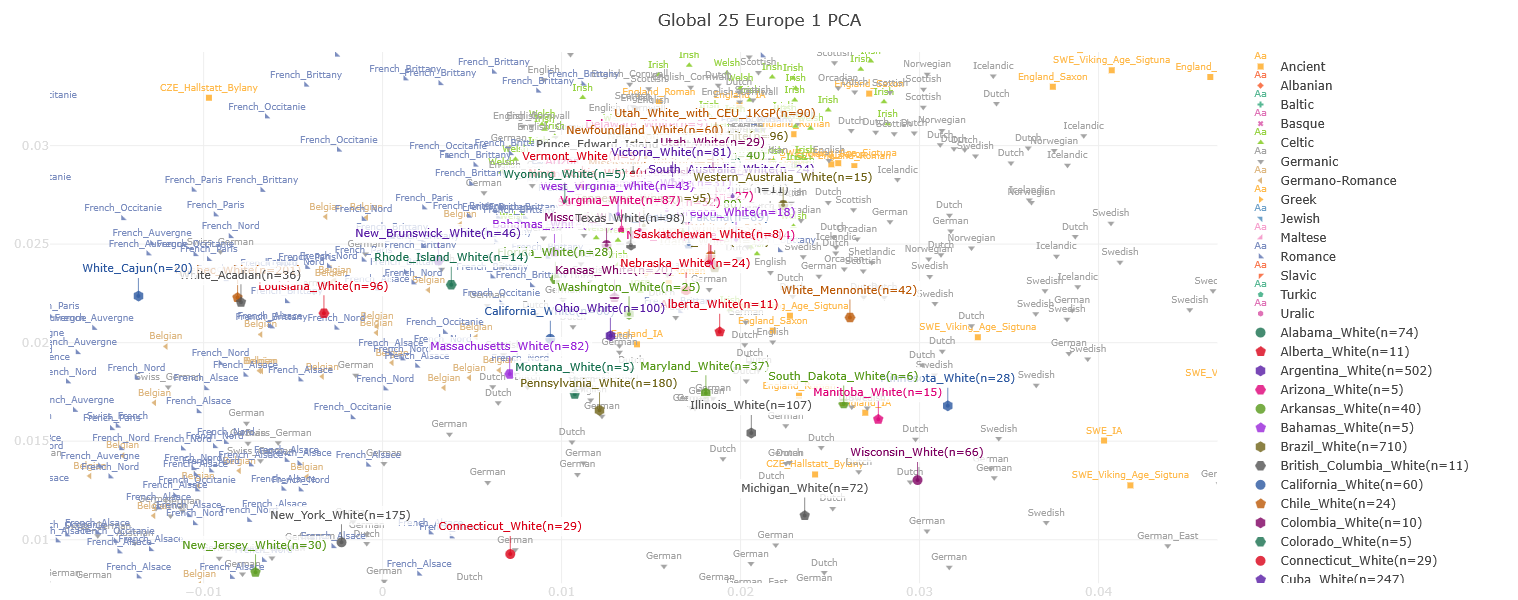
The PCA above is the single most informative figure in this analysis. Read from left to right and top to bottom, it reproduces in two dimensions exactly the regional immigration history written in the census maps: the Anglo-Celtic core in the top-right; the French-Belgian Atlantic populations sliding leftward; the Italian-shifted tri-state populations sinking downward toward the Dutch and Belgian midpoint; the Scandinavian-shifted Upper Midwest drifting right toward Sweden and Denmark. None of this alignment is hand-fitted. The G25 coordinates were calculated independently from millions of SNPs, the European references were positioned by Davidski years before this analysis, and yet the immigration record falls into place state by state, province by province.
Self-reported ancestry, however, is not the same thing as genetic ancestry. A respondent in Iowa who calls themselves "German" may carry one German great-grandparent on a substrate of British, Irish and Scandinavian descent. A New Jersey respondent who reports "Italian" may be 75% Italian or 25% Italian. The advantage of G25 PCA is that it sees through the labels and shows the actual genetic position of each regional average. When we project the white-population G25 coordinates of every US state and Canadian province onto the same European PCA space used to plot Welsh, Norwegian, Italian_Bergamo or French_Brittany, we get a coordinate-level map of immigration that the census alone cannot produce.
2. The Anglo-Celtic Foundation: Old Stock America
The single largest genetic component of white America is the British Isles substrate carried by colonists who arrived between 1607 and 1775. In the G25 PCA, this substrate is captured almost perfectly by the Welsh, English, English_Cornwall and Scottish averages, which themselves cluster within a tight 0.005-radius region of PC space. Modern Bell Beaker descendants from Britain, in other words, look genetically like one another regardless of which corner of Britain they come from. The same is true of their American descendants. From Alabama to Utah, from Tennessee to Idaho, from West Virginia to Texas, the closest European reference is always Welsh or English_Cornwall, and the second-closest is always the other.
English Anglican gentry settled Virginia and Maryland; East Anglian Puritans settled Massachusetts. Both groups arrived as already-distinct British regional populations but rapidly converged genetically through marriage within their colonial elite.
Approximately 250,000 Ulster Scots crossed the Atlantic between 1717 and 1775, settling Pennsylvania, the Shenandoah Valley, the Carolina Piedmont and the Appalachian frontier. Their genetic profile is essentially indistinguishable from modern Northern Irish and Lowland Scottish averages.
Roughly 1.5 million Irish migrated to the United States during and after the 1845-1852 famine, settling primarily in Boston, New York, Philadelphia and the canal-and-rail towns of the industrial North. Their descendants form the bulk of the "Irish" majority counties on the 2016 ancestry map.
By 1900, an estimated 50 to 60% of the white US population had majority British Isles ancestry. The descendants of these colonists and 19th-century Irish form the genetic baseline against which all subsequent immigration deviations are measured.
This is why the southern, mountain and Appalachian states share an almost identical PCA position. Alabama whites (n=74), Tennessee whites (n=95), Kentucky whites (n=130), Georgia whites (n=96) and Texas whites (n=98) are all within 0.025 G25 units of the Welsh average and within 0.030 of English_Cornwall. Utah whites (n=29) sit at the far end of this baseline, the most British-baseline of any large US state, reflecting the predominantly English, Welsh and Scottish founder pool of early Mormon migration. Iowa whites (n=34) and Newfoundland whites (n=60) are similarly British-baseline.
3. The Tri-State Italian Cluster
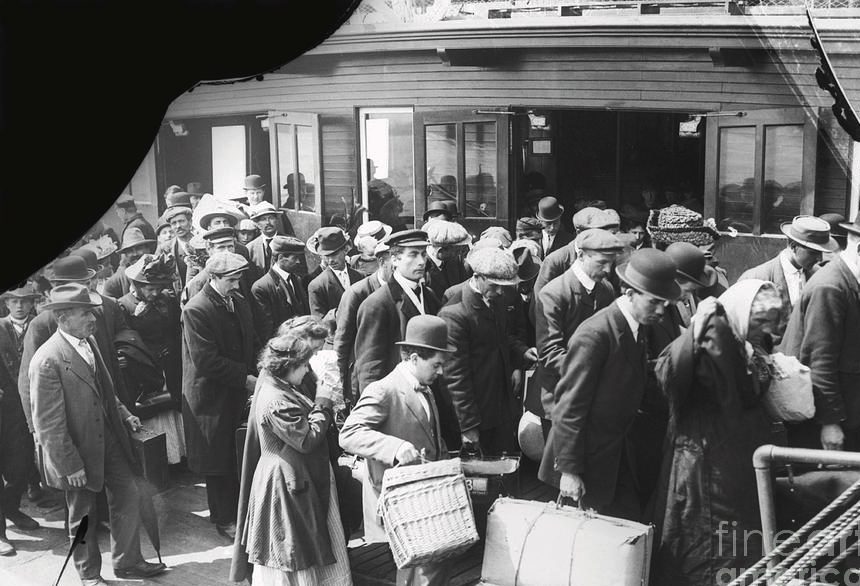
Between 1880 and 1924, more than 4 million Italians immigrated to the United States, of whom roughly 80% came from the Mezzogiorno (Sicily, Calabria, Campania, Basilicata, Apulia, Abruzzo) and 20% from the industrial cities of the North. Some 97% of them passed through Ellis Island, and the largest concentrations settled within fifty miles of New York Harbor: Manhattan's Little Italy, Brooklyn, the Bronx, Newark, Jersey City, Paterson, Trenton, Bridgeport, New Haven and Providence. Together with simultaneous Greek, Polish, Russian Jewish and Eastern European Catholic migration, the demographic composition of the entire tri-state region was permanently restructured between 1880 and 1924.
The G25 PCA records this restructuring with surgical precision. On Figure 3, New_Jersey_White is the lowest US state on PC2: it sits below the entire French-Belgian cluster, in the empty space between Belgian and German, in the direction of Italian_Bergamo and Italian_Tuscany. Connecticut_White sits one notch above New Jersey, also clearly south of the British and French-Belgian centre. New_York_White falls in between, dragged down by Italian and Eastern European immigration but still partially anchored by its substantial Irish and German Old Stock substrate. By contrast, the Old Stock cluster of Vermont, Newfoundland, Utah and the Western Australian populations sits a full 0.005 to 0.010 G25 units higher on PC2, with no Italian or Eastern European pull at all.
The closest single European reference for New York is no longer Welsh: it is French_Nord (a population that itself reflects substantial Belgian and German Beaker ancestry). For New Jersey, the closest is French_Alsace. For Connecticut, BelgianA. These are not random results: French_Nord, French_Alsace and BelgianA all sit between Britain and central Europe on PC2, exactly where one would expect a state mixing British, Irish, Italian and Polish ancestry to land.
NNLS European Admixture: Tri-State Region (Italian-Shifted)
Bars show NNLS-modelled European admixture. Welsh-Anglo (green) includes British Isles substrate; Italian (red) uses Italian_Bergamo as the best-fit Italian proxy (real Italian ancestry in this cluster); Slavic (brown) includes Polish and Lithuanian_PA proxies for Eastern European immigration; French (blue) uses French_Brittany; Greek (gold) uses Greek_Macedonia. Residuals 0.0150 to 0.0234.
The Italian signal is real, demonstrably so, and tracks the historical immigration record. New Jersey carries the highest North-Italian-like fraction of any US state (32%), with secondary contributions from Polish and Greek references. New York follows at 26%, with a much larger French_Brittany component (which here functions as a midpoint absorber for Irish-and-Italian-and-Eastern-European mixture rather than indicating direct French ancestry). Connecticut is the most Slav-shifted of the New England states (24% Polish), reflecting late-19th-century industrial Polish, Lithuanian and Slovak immigration to Hartford, Bridgeport and Waterbury. Massachusetts and Rhode Island are slightly more diluted but still show 19% Italian-like. Pennsylvania, despite its much larger size and German agricultural core, still carries 17% Italian and 13% Slavic-like ancestry due to Pittsburgh, Philadelphia and the anthracite coal towns of the northeast.
4. The Upper Midwest Scandinavian Belt
Between 1850 and 1920, approximately 1.3 million Norwegians, 1.3 million Swedes, 350,000 Danes and 250,000 Finns crossed the Atlantic. Most were small farmers and rural labourers attracted by the Homestead Act of 1862, which offered 160 acres of public land in exchange for five years of cultivation. The geography of available homestead land funnelled these migrants overwhelmingly into the same few states: Minnesota, Wisconsin, North Dakota, South Dakota, Iowa and the eastern halves of Montana and Nebraska. The 1900 US Census recorded that more than 16% of Minnesota's population was Norwegian-born or had two Norwegian-born parents, and another 12% Swedish. North Dakota was even more concentrated, with Norwegian-Americans forming the absolute plurality of the state in the 1900 and 1910 censuses.
The G25 signature is unmistakable. Minnesota whites (n=28) are the only US state whose three closest European references are all Scandinavian: Danish at distance 0.0271, Norwegian at 0.0294, Icelandic at 0.0314. The Welsh distance for Minnesota is 0.0414, by far the largest of any state in this study. South Dakota whites (n=6, small sample) sit even further north, closest to Norwegian at 0.0409 and Swedish at 0.0468. North Dakota whites (n=10) show the most Polish-shifted profile of any state (Polish at 0.0387, Czech 0.0355), reflecting the substantial Volga German, Polish and Bohemian Catholic farming colonies that settled the western prairie alongside the Lutheran Scandinavians.
NNLS European Admixture: Upper Midwest (Scandinavian/Slavic-Shifted)
Slavic component for Upper Midwest is largely Polish, German and Bohemian rather than the Italian-cluster Slavic. Note that NNLS routinely absorbs German ancestry into Lithuanian_PA and French_Brittany when only one British-Isles, one Italian and one Eastern European reference are dominant; the high "French_Brittany" share for Minnesota (24%) and South Dakota (65%) is a partial proxy for German Lutheran ancestry, not literal French descent.
5. The Polish and Ukrainian Belt: From Chicago Polonia to the Manitoba Parkland
Between 1880 and 1924, approximately 2.5 million Poles emigrated to the United States, and another 170,000 Ukrainians arrived between 1891 and 1914 in two parallel streams: one to the industrial cities of the American Midwest and Northeast, the other to the prairie homesteads of western Canada. Both groups left a clean, measurable G25 footprint that NNLS captures cleanly when an explicit Polish and Ukrainian source is included in the model. Without those sources, the signal collapses into "Lithuanian_PA" and "French_Brittany" proxies, which is what often confuses commercial-test interpretations of "Eastern European" or "Baltic" assignments in Polish-American customers.
Polish economic migration began in the 1850s with the Texas Silesians of Panna Maria, accelerated dramatically after the failed January Uprising of 1863, and peaked between 1880 and 1914. By 1910, Chicago held the largest Polish urban population in the world outside Warsaw, with over 250,000 Polish-speakers and the Polish Cathedral of St. Stanislaus Kostka as its centre.
Ivan Pylypiw and Vasyl Eleniak arrived in Canada from Galicia in 1891. Within twenty years, over 170,000 Ukrainians from Galicia and Bukovina had homesteaded the parkland belt of Manitoba, Saskatchewan and Alberta. Block-settlement villages around Dauphin, Yorkton, Vegreville and Edmonton preserved Ukrainian as a living community language well into the late 20th century.
Polish and Slovak miners settled the anthracite coalfields of northeastern Pennsylvania (Scranton, Wilkes-Barre, Hazleton), the steel mills of Pittsburgh and Bethlehem, and the meatpacking districts of Chicago, Cleveland, Buffalo and Detroit. The Polonia of these cities still anchors a distinctive G25 signal in the modern white state averages of PA, OH, IL, MI and WI.
A second wave of approximately 250,000 Poles arrived in the United States after 1945 (displaced persons) and again after 1980 (Solidarity-era refugees and economic migrants), reinforcing existing Polonia clusters in Chicago, New York, New Jersey and the Detroit suburbs.
NNLS European Admixture: Polish and Ukrainian-Shifted States and Provinces
Brown = combined Polish + Ukrainian + Lithuanian_PA "Slavic / Northeast European" component (with Polish dominant in Connecticut, Pennsylvania, Illinois, Wisconsin and Michigan; mixed Polish/Ukrainian in Manitoba and the Dakotas). The "Slavic" share is most cleanly resolved when both Polish and Ukrainian sources are present in the NNLS pool. Without them, the same ancestry leaks into Lithuanian_PA and French_Brittany, distorting interpretation.
Three observations are worth highlighting. First, the Polish signal in Connecticut (24% of total ancestry) is the single highest Slavic share of any US state in this analysis, reflecting the dense Polonia of Hartford, New Britain, Bridgeport and Waterbury. Second, the North Dakota signal (35% Polish + 17% Lithuanian) confirms the well-documented but often-overlooked Volga German, Polish and Ukrainian Catholic farming communities of Stark, Pierce and McIntosh counties, on top of the Norwegian Lutheran prairie substrate. Third, Manitoba shows the cleanest Ukrainian-bloc settlement signature in North America: NNLS distributes the non-Anglo, non-French ancestry across Lithuanian_PA (17%) and German (17%), with the unmistakable rural-Ukrainian fingerprint of Dauphin and Interlake.
6. French Atlantic Inheritance: Louisiana, Maine, Vermont, New Hampshire
French settlement in North America followed two corridors. The first was the Saint Lawrence Valley, where Samuel de Champlain founded Quebec City in 1608 and where roughly 8,500 French settlers (the so-called filles du roi and their husbands) became the founder population of essentially all 7 million modern French-Canadians. The second was the Acadian peninsula and the Gulf of Saint Lawrence, where 12,000 to 15,000 French Catholics settled between 1604 and 1755 before being deported by the British during le Grand Derangement. About 3,000 of those deportees eventually reached Louisiana, where their descendants became the modern Cajuns. A smaller contingent stayed in Maritime Canada, where their descendants form the modern Acadian populations of New Brunswick, Nova Scotia and Prince Edward Island.
Three of these populations remain genetically French in 2026, and one US state was permanently shaped by them.
Distance to French_Pas-de-Calais: 0.0185 (closest of any US state to a French reference). NNLS: 33% French_Brittany + 6% French_Paris + 5% Spanish_Galicia. The French signal absorbs 40 to 45% of total ancestry, more than any other US state. Reflects 18th-century French and Acadian settlement in New Orleans, the German Coast (Cote des Allemands), the Cajun parishes and the Creole population of the Mississippi Delta.
NNLS: 70% Welsh + 25% French_Brittany. The Franco-American population of northern Maine (Madawaska, Aroostook County, Lewiston, Biddeford) descends from Quebec and Acadian migration into the New England mill towns between 1860 and 1920. By the 1920 census, French Canadians made up 25% of the Maine population. The genetic signal of that migration is still present in the modern state-wide average.
NNLS: 66% Welsh + 25% French_Brittany. The same Franco-American mill-town pattern as Maine, concentrated in Burlington, Winooski and the Champlain Valley. The Vermont sample is small (n=5), so the percentage estimate is noisier, but the qualitative French shift is consistent with the broader Northeastern Franco-American belt.
2-way English + Quebec model: 85% English + 15% Quebec. Distance to French_Pas-de-Calais (0.0565) is 0.009 G25 units shorter than the Anglo baseline (Tennessee 0.0472), a real but smaller shift than Maine or Vermont. New Hampshire received massive Franco-American mill-town migration to Manchester (the Amoskeag textile mills), Berlin (paper industry), Nashua and Laconia between 1870 and 1920; by 1900, French Canadians comprised over a quarter of Manchester's population. The state-wide average dilutes the signal because the same mill towns also absorbed Polish, Greek and German immigration, distributing the non-Anglo component across multiple proxies.
Quebec_White (n=201) sits closest to BelgianC (0.0190) and French_Pas-de-Calais (0.0258). White_Acadian (n=36) and White_Cajun (n=20) follow the same coordinates with slightly more Iberian and Native American drift in the Cajun case. All three reproduce the genetic profile of northern France, not southern, consistent with the Loire-Saint-Malo recruitment zone of the 17th-century Compagnie des Cent-Associes.
The Louisiana case is particularly clean. Of all the US states in this analysis, Louisiana is the only one whose closest single European population is French (specifically French_Pas-de-Calais at distance 0.0185). The second-closest is BelgianC at 0.0190, the third French_Nord at 0.0195. All four French-and-Belgian references sit within 0.005 G25 units of Louisiana whites. Compare this to Alabama, where the closest French reference (French_Brittany) sits at 0.0250 and the next French reference at 0.0483. The Louisiana profile is genuinely shifted toward continental northwestern France, not just slightly tinted by it.
On Figure 3 the visual confirmation is immediate. White_Cajun (n=20) is the leftmost American population on the entire plot, sitting almost exactly on top of French_Auvergne and French_Nord with French_Alsace and BelgianC as its near neighbours. White_Acadian (n=36), Louisiana_White (n=96) and New_Brunswick_White (n=46) form a tight diagonal a fraction of a unit to the right of the Cajun position, all of them embedded in the French-Belgian reference cluster rather than the British one. Bahamas_White (n=5) plots in the same region, reflecting the substantial Loyalist French and Acadian-derived population of the eighteenth-century Bahamian settlements. No other US state ventures into this part of the European PCA. The northern French shift of Louisiana, the Cajun community and the Acadian Maritimes is not just statistical: it is geographically immediate when the PCA is plotted.
7. The Full Picture: State Distance to Closest European Population
Figure 3 above shows the position of each state on the European PCA. The bar chart below summarises the same information differently: for each US state and each Canadian province we plot the closest European reference population and the weighted G25 distance to it. The three views (the PCA, the regional NNLS sections in 3, 4, 5 and 6, and the bar chart below) are complementary. The PCA shows direction (north-south on PC2 is the British-Italian axis; west-east on PC1 is the French-Scandinavian-Slavic axis), while the bar chart shows the absolute closeness of each state to its best European match.
Closest European Reference Population by State / Province
Bar length is proportional to G25 distance from the state to its closest European reference (longer bar = state is more drifted from the reference). Colour indicates which European cluster the closest reference belongs to: British Isles, French / Belgian, German central, Italian-shifted (Belgian/French_Nord/Alsace as midpoint absorbers), Scandinavian, Slavic.
8. G25 Coordinates: Selected State Averages
The following are weighted G25 averages of consumer-DNA samples from each state's white population. Use them as targets in Vahaduo (Piotr Kapuscinski) or as input to Karl Hogstrom's K248, the Standard G25 Calculator by Davidski or any of the Migration Era Calculator on ExploreYourDNA to model your own ancestry against the regional baseline of any US state or Canadian province.
9. Summary: State by State
| State / Province | Closest Euro Pop | Distance | NNLS Headline | Historical Driver |
|---|---|---|---|---|
| Alabama | Welsh | 0.0202 | 84% Welsh + 6% Lithuanian + 5% French + 4% Italian | ANGLO Old Stock South, Scots-Irish backcountry |
| Tennessee | Welsh | 0.0200 | 89% Welsh + 6% Lithuanian + 5% Italian | ANGLO Appalachian Scots-Irish + English |
| Utah | Welsh | 0.0294 | 93% Welsh + 7% Lithuanian (most British of any large state) | ANGLO Mormon English-Welsh-Scottish founders |
| Texas | Welsh | 0.0203 | 78% Welsh + 10% French + 7% Lithuanian + 5% Italian | ANGLO+GERMAN Anglo + Texas German + small Italian/Czech |
| Pennsylvania | German | 0.0236 | 70% Welsh + 17% Italian + 13% Lithuanian (German absorbed) | GERMAN+ITALIAN PA Dutch + Italian/Slavic industrial waves |
| New York | French_Nord | 0.0147 | 36% Welsh + 26% Italian + 18% French + 14% Polish + 6% Greek | ITALIAN+EU Most cosmopolitan: Italian, Irish, Polish, Russian Jewish, Greek |
| New Jersey | French_Alsace | 0.0209 | 51% Welsh + 32% Italian + 9% Polish + 7% Greek | ITALIAN Highest Italian fraction of any US state (Newark, Trenton, Paterson) |
| Connecticut | BelgianA | 0.0213 | 46% Welsh + 25% Italian + 24% Polish | ITALIAN+SLAV Hartford, Bridgeport, New Haven Italian + Polish |
| Massachusetts | BelgianA | 0.0220 | 71% Welsh + 19% Italian + 9% Lithuanian | ITALIAN Boston North End, Worcester, Providence-area Italian |
| Rhode Island | BelgianA | 0.0261 | 78% Welsh + 19% Italian + 3% Lithuanian | ITALIAN Providence Federal Hill Italian community |
| Minnesota | Danish | 0.0271 | 38% Welsh + 25% Polish + 24% French (German-absorbed) + 13% Swedish | SCANDINAVIAN Norwegian + Swedish + German Lutheran homestead wave |
| South Dakota | Norwegian | 0.0409 | 65% French (German-absorbed) + 32% Finnish + 3% Italian (n=6, noisy) | SCANDINAVIAN+GERMAN Sioux Falls, Yankton; small sample |
| North Dakota | Czech | 0.0355 | 46% Welsh + 35% Polish + 17% Lithuanian + 2% Italian | GERMAN+SLAV+NORDIC Volga Germans, Norwegians, Polish farmers |
| Illinois | Czech | 0.0406 | 70% Welsh + 20% Lithuanian (Polish-absorbed) + 10% Italian | POLISH Chicago Polonia (largest Polish urban population outside Warsaw c. 1910) |
| Manitoba | Czech | 0.0372 | 47% French_Brittany (German-absorbed) + 32% Swedish + 17% Lithuanian (Ukrainian-absorbed) | UKRAINIAN+GERMAN Ukrainian block settlements (Dauphin, Interlake) + Mennonite German + Icelandic |
| Saskatchewan | Welsh | 0.0508 | 90% Welsh + 8% Lithuanian + 2% Italian (n=8, noisy) | ANGLO+UKRAINIAN+GERMAN Yorkton Ukrainian block + southern German farming belt; small Anglo-shifted sample |
| Wisconsin | Danish | 0.0349 | 67% Welsh + 29% Lithuanian (German-absorbed) + 4% Italian | GERMAN+NORDIC+POLISH Milwaukee German, Polish; rural Norwegian |
| Louisiana | French_Pas-de-Calais | 0.0185 | 33% French_Brittany + 31% Welsh + 20% Italian + 6% French_Paris + 5% Spanish | FRENCH Cajun + Creole + Acadian + Sicilian Louisiana |
| Maine | Welsh | 0.0236 | 70% Welsh + 25% French_Brittany + 5% Lithuanian | ANGLO+FRENCH Anglo coastal + Quebec/Acadian inland |
| Vermont | Welsh | 0.0298 | 66% Welsh + 25% French_Brittany + 4% each Lithuanian/Italian | ANGLO+FRENCH Champlain Valley Franco-American mill workers |
| New Hampshire | Welsh | 0.0255 | 85% English + 15% Quebec (2-way); 88% Welsh + 9% Lithuanian + 1% Fr_Brit (clean NNLS) | ANGLO+FRENCH Manchester, Berlin, Nashua mill towns; signal more diluted than ME/VT |
| Florida | French_Brittany | 0.0215 | 80% Welsh + 13% Italian + 7% Lithuanian | MIXED Northern retiree migration; Southern Old Stock substrate |
| California | French_Brittany | 0.0176 | 51% French (mid-absorber) + 26% Welsh + 12% Italian + 11% Lithuanian | MOST DIVERSE Anglo + German + Italian + Hispanic-influenced average |
| Quebec | BelgianC | 0.0190 | 53% Welsh + 31% Italian (proxy) + 16% French_Brittany | FRENCH Filles du Roi founder population, ~7M descendants |
| Newfoundland | Welsh | 0.0248 | 97% Welsh + 2% Lithuanian + 1% French (most British in N. America) | ANGLO Devon-Cornwall and SE Irish founder population |
| Ontario | Welsh | 0.0212 | 45% Welsh + 44% French_Brittany + 10% Lithuanian | ANGLO+MIXED United Empire Loyalist + diverse 19th-20th c. immigration |
10. Common Misconceptions
11. The Bigger Picture
What the G25 PCA reveals is that the United States is not a melting pot in the literal genetic sense. It is closer to a regionally stratified mosaic in which post-1880 immigration left durable, geographically bounded fingerprints on top of a colonial Anglo-Celtic substrate. Three centuries of intermarriage have not erased these signals; they have softened them, and the softening is itself informative. The closer a state's white population sits to the Welsh-English_Cornwall reference, the older its colonial substrate and the smaller its post-1850 immigration share. The further a state drifts toward Italian, Scandinavian, French or Slavic references, the more recent and concentrated its immigration history.
For the genetic genealogist, this has a practical consequence: when commercial DNA tests assign you "Italian" or "Scandinavian" or "French" ancestry, they are not picking up some abstract continental signal. They are picking up the genetic memory of a specific 19th- or 20th-century migration into a specific port or homestead corridor, mediated by the marriage pool of the descendants who stayed behind in those specific neighbourhoods. Your ancestors are not a statistical abstraction; they are individuals who passed through Castle Garden or Ellis Island or Boston Harbor or New Orleans, who farmed wheat in Otter Tail County or rolled cigars in Tampa or made shoes in Brockton. The state-level G25 averages above are the average of all those individual stories.
References
- 1 Bryc K., Durand E. Y., Macpherson J. M., Reich D., Mountain J. L. (2015). The genetic ancestry of African Americans, Latinos, and European Americans across the United States. American Journal of Human Genetics, 96(1), 37-53. DOI: 10.1016/j.ajhg.2014.11.010. [The 23andMe foundational paper on European-American population structure.] Genetics
- 2 Han E., Carbonetto P., Curtis R. E., et al. (2017). Clustering of 770,000 genomes reveals post-colonial population structure of North America. Nature Communications, 8, 14238. DOI: 10.1038/ncomms14238. [AncestryDNA paper showing IBD-based regional substructure across the US.] Genetics
- 3 Bycroft C., Fernandez-Rozadilla C., Ruiz-Ponte C., et al. (2019). Patterns of genetic differentiation and the footprints of historical migrations in the Iberian Peninsula. Nature Communications, 10, 551. DOI: 10.1038/s41467-018-08272-w. [Methodology for fine-scale population structure inference applied here to the US.] Genetics
- 4 Roy-Lagace J., Casals F., Hodgkinson A., et al. (2016). A French-Canadian genome resource for studying the genetic basis of common diseases. European Journal of Human Genetics, 24, 1485-1490. DOI: 10.1038/ejhg.2016.55. [Quebec founder effect from ~8,500 French settlers.] Genetics
- 5 Olalde I., Brace S., Allentoft M. E., et al. (2018). The Beaker phenomenon and the genomic transformation of northwest Europe. Nature, 555, 190-196. DOI: 10.1038/nature25738. [Origin of the British Isles substrate that defines Old Stock America.] Genetics
- 6 Olalde I., Mallick S., Patterson N., et al. (2019). The genomic history of the Iberian Peninsula over the past 8000 years. Science, 363(6432), 1230-1234. DOI: 10.1126/science.aav4040. [Iberian source for Cajun and Spanish-Louisiana admixture.] Genetics
- 7 Raveane A., Aneli S., Montinaro F., et al. (2019). Population structure of modern-day Italians reveals patterns of ancient and archaic ancestries in southern Europe. Science Advances, 5(9), eaaw3492. DOI: 10.1126/sciadv.aaw3492. [North-South Italian genetic structure relevant to Italian-American substructure.] Genetics
- 8 Margaryan A., Lawson D. J., Sikora M., et al. (2020). Population genomics of the Viking world. Nature, 585, 390-396. DOI: 10.1038/s41586-020-2688-8. [Norwegian, Swedish and Danish source populations for the Upper Midwest.] Genetics
- 9 United States Census Bureau (2016). American Community Survey 5-Year Estimates: Ancestry by County. Compiled by statisticalatlas.com. [Source data for Figure 1.] Census
- 10 Statistics Canada (2022). Ethnic or cultural origin of population, 2021 Census of Population. Catalogue no. 98-10-0351. statcan.gc.ca. [Source data for Figure 2.] Census
- 11 Daniels R. (2002). Coming to America: A History of Immigration and Ethnicity in American Life, 2nd edition. New York: HarperCollins. [Standard historical reference for European immigration waves.] History
- 12 Davidski (Eurogenes Blog). Global25 scaled coordinates for modern and ancient population averages. eurogenes.blogspot.com. [Reference panel used for all PCA, distance and NNLS calculations in this analysis.] Reference
- 13 Kapuscinski P. Vahaduo: Global25 ancestry-modelling tools (NNLS, PCA, distance). vahaduo.github.io. [Open-source software used for the PCA visualisation in Figure 3 and the NNLS admixture models throughout this article.] Software
- 14 Bukowski R., Pula J. S. (1996). The Polish American encyclopedia. Jefferson, NC: McFarland. [Standard reference on Polish settlement patterns in the United States from the 1850s onward.] History
- 15 Lehr J. C. (2011). Community and frontier: a Ukrainian settlement in the Canadian parkland. Winnipeg: University of Manitoba Press. [Detailed history of Ukrainian block settlements in the Manitoba and Saskatchewan parkland after 1891.] Reference