The Central-Western Europe Calculator by Oliver:
Disentangling Bell Beaker, Germanic, Hallstatt, and Roman Ancestry
If you have Central or Western European ancestry, you have probably struggled to get meaningful results from generic G25 calculators that blur together populations which are actually historically quite distinct. The Central-Western Europe Calculator by Oliver, available on ExploreYourDNA, was built specifically to address this problem. By anchoring its source populations to carefully chosen ancient DNA references, spanning Bell Beaker, Germanic Iron Age, Hallstatt Celtic, and Roman-era samples, it offers a level of historical resolution that general-purpose tools cannot match.
Table of Contents
- 1. The Historical Layers of Central-Western Europe
- 2. The Calculator Sources: What Each Proxy Represents
- 3. Bell Beaker vs. Germanic: The Calculator's Core Strength
- 4. Hallstatt and Roman Ancestry: Separating the Celtic and Mediterranean Layers
- 5. PCA: All Populations in G25 Space
- 6. Patterns Across Central-Western Europe
- 7. How to Use the Calculator
- 8. G25 Coordinates: Central-Western European Reference Populations
1. The Historical Layers of Central-Western Europe
Central and Western Europe is genetically one of the most layered regions on earth. The modern populations of France, Germany, the Netherlands, Belgium, and neighbouring countries descend from at least four major ancestral episodes that have left distinguishable, if overlapping, genetic signatures in present-day genomes.
The deepest of these is the Bell Beaker substrate. Between 2500 and 1800 BCE, groups carrying the Bell Beaker package, characterized by a distinctive material culture and high proportions of Steppe-related ancestry, swept across Northwestern Europe. Their descendants formed the ancestral population of both later Celtic-speaking and Germanic-speaking peoples. In the Netherlands and northern France, this founding signal is captured particularly well by the ancient individuals from Valkenburg in the Dutch coastal zone, who represent a pre-linguistic, broadly Bell Beaker Northwestern European ancestral component.
By the Iron Age (circa 800, 50 BCE), a recognizable Germanic cultural and genetic block had emerged in Jutland and the North Sea littoral, distinguishable from the Bell Beaker base by the increasing contribution of Scandinavian Hunter-Gatherer ancestry via the Nordic Bronze Age. Meanwhile, the Hallstatt Celtic world crystallized in central Europe, present-day Austria, Bavaria, and the Rhineland, and later the La Tène expansion spread Celtic culture from the Alps into France, Britain, and Iberia. Finally, Roman military and civilian migration during the first four centuries CE introduced a measurable Southern European, Mediterranean-inflected ancestry into the Rhine-Danube frontier zones and Roman urban centres.
Figure 1: The four principal historical ancestry layers modelled by the Central-Western Europe Calculator, with their ancient DNA proxy populations. The Slavic source (Poland Early Medieval) serves as an additional control for populations with a northeastern genetic gradient.
populations used
as sources
Denmark Jutland IA
reference (n=42)
captured in a single
admixture run
2. The Calculator Sources: What Each Proxy Represents
The strength of any G25 calculator lies in the choice of its source populations. Oliver's Central-Western Europe Calculator is built around seven ancient DNA reference groups, each carefully selected to represent a distinct historical ancestry layer. Here is what each source captures and why it was chosen.
Netherlands_Valkenburg_IA (n=19)
Iron Age individuals from the Valkenburg site in the Dutch coastal zone. These represent the Bell Beaker-derived substrate of Northwestern Europe: proto-Germanic and proto-Celtic before linguistic and cultural differentiation. Rich in WHG and Steppe ancestry with minimal Scandinavian Hunter-Gatherer signal. The purest available proxy for early Bell Beaker Northwestern European ancestry.
Denmark_Jutland_IA (n=42)
Iron Age individuals from Jutland, the core territory of early Germanic populations. Compared to Valkenburg, these samples carry an elevated Scandinavian Hunter-Gatherer component reflecting the Nordic Bronze Age contribution. This is the key contrast with Valkenburg that allows the calculator to separate Bell Beaker from Germanic ancestry.
Germany_Hallstatt_IronAge (n=28)
Individuals from the Hallstatt culture sites in the German-speaking Alpine zone, the archaeological epicentre of early Celtic civilization. Genetically, they carry a slightly elevated EEF (Early European Farmer) signal relative to purely Bell Beaker populations. Together with France_SouthEast_IA2, this source captures the distinctive continental Celtic ancestry layer.
France_SouthEast_IA2 (n=5)
Iron Age individuals from southeastern France, an area at the crossroads of Hallstatt Celtic influence and early Mediterranean contact. This source contributes to the model's ability to detect the Gaulish Celtic component in southern French populations and helps pull apart Hallstatt ancestry from Roman-era admixture.
Italy_Imperial (n=36)
Imperial-era Roman individuals representing the cosmopolitan genetic profile of Rome during its peak, a mixture of Italian Neolithic farmer ancestry with varying Near Eastern and North African contributions brought by migration within the Empire. This source captures the distinctly southern, Mediterranean-shifted ancestry introduced along Roman military and trade routes.
Austria_MigrationPeriod_Pannonian (n=14)
Individuals from Migration Period (4th, 6th century CE) Pannonia (modern Austria/Hungary), representing the complex genetic legacy of late Roman frontier populations admixed with arriving Germanic groups. Useful for capturing the residual Roman-provincial component in central European populations.
Poland_EarlyMedieval_Slavic (n=45)
Early medieval Slavic individuals from Poland, representing the eastern genetic drift that becomes relevant in eastern German regions (Saxony, Brandenburg, Mecklenburg) through the historically documented Slavic settlement of territories east of the Saale-Elbe line. This source is expected to be minimal or absent in core Western European populations but registers detectably in populations with historical Slavic substrate ancestry.
3. Bell Beaker vs. Germanic: The Calculator's Core Strength
The most important axis this calculator resolves, and the one that general-purpose G25 tools handle most poorly, is the distinction between the original Bell Beaker Northwestern European substrate and the later Germanic Iron Age signal. This separation matters because it allows us to see which parts of a modern individual's genome reflect the pre-linguistic founding population of Northwestern Europe, and which reflect the specifically Germanic character that emerged in Jutland and the North Sea coast during the Bronze and Iron Age.
The key contrast in G25 space between Netherlands_Valkenburg_IA (Bell Beaker proxy) and Denmark_Jutland_IA (Germanic proxy) is subtle but consistent. The Jutland Iron Age individuals carry a higher loading on the PC dimensions that capture Scandinavian Hunter-Gatherer ancestry, the signature of the pre-Indo-European inhabitants of Scandinavia whose ancestry was incorporated into the Germanic gene pool during the Nordic Bronze Age. Valkenburg individuals, being from the Dutch coastal zone, lack this elevated Scandinavian component.
Figure 2: Corrected gradient from Bell Beaker (Valkenburg-like) to Germanic (Jutland-like) ancestry. Brittany anchors the Bell Beaker end: its Atlantic Celtic heritage has preserved the Valkenburg signal with minimal Frankish overlay. Belgian and Dutch populations are intermediate but already lean Germanic compared to Brittany, reflecting Frankish settlement. Northern German coastal regions (Schleswig-Holstein, Mecklenburg) anchor the Germanic pole, being closest in G25 space to Denmark_Jutland_IA.
This ordering corrects a common intuition: although the Netherlands is geographically close to the Valkenburg source sites, modern Dutch populations, especially Dutch North, score notably more Germanic (Jutland_IA) than Brittany does, because centuries of Frankish, Saxon, and Frisian settlement added a real Germanic ancestry layer on top of the coastal Bell Beaker substrate. Brittany, by contrast, was barely touched by the Frankish expansion that reshaped the Low Countries, and retains the highest Valkenburg_IA signal of any modern population in the dataset. Populations from Schleswig-Holstein and Mecklenburg-Vorpommern, geographically closest to the Jutland source, naturally anchor the Germanic pole.
4. Hallstatt and Roman Ancestry: Separating the Celtic and Mediterranean Layers
Beyond the Bell Beaker/Germanic axis, the calculator's second major strength lies in its ability to distinguish Hallstatt Celtic ancestry from Roman-era Mediterranean admixture, two historically real signals that generic calculators frequently conflate, since both pull individuals slightly southward in standard G25 space.
The Hallstatt Signal
The Hallstatt culture (circa 800, 450 BCE) originated in the eastern Alpine zone and spread Celtic language and culture across a vast arc from the Iberian Peninsula to Anatolia. Genetically, Hallstatt individuals carry a somewhat elevated EEF (Early European Farmer) component compared to purely Bell Beaker Northwestern Europeans, reflecting the deeper south-central European substrate they inherited. This signal becomes important for southern German regions (Bayern, Baden-Württemberg), eastern France (Alsace), and the Rhine-Moselle zone where Hallstatt Celtic culture was most concentrated.
In the calculator, both Germany_Hallstatt_IronAge and France_SouthEast_IA2 capture this component from slightly different angles. The German Hallstatt samples represent the culture's Alpine heartland; the southern French Iron Age samples represent the Gaulish reception of Hallstatt and La Tène Celtic culture in the Rhone corridor, which was also the main gateway for early Greek and Etruscan Mediterranean contact before Roman conquest.
The Roman Signal
Roman conquest brought not just roads and aqueducts but people. The Italy_Imperial source captures the genetically cosmopolitan profile of Roman-era Italy, which already differed from modern Italians by carrying higher Near Eastern ancestry than the modern Italian average, reflecting the Empire's demographic mobility. The Austria_MigrationPeriod_Pannonian source adds a related but distinct late Roman-frontier component. Together, these two sources model the Mediterranean-shifted ancestry that Romans, legionary veterans, traders, and slaves introduced along the Rhine-Danube limes and into provincial urban centres.
Figure 3: Schematic distribution of French regional populations by their expected Hallstatt Celtic and Roman ancestry signals in this calculator. Atlantic and northern French regions cluster near the Bell Beaker origin (low on both axes), while southern and eastern regions show progressive elevation of Hallstatt Celtic and/or Roman signals. Corsica stands as the clearest outlier, with the highest Roman ancestry. Note: positions are schematic based on historical and genetic expectations, not calculated admixture outputs.
5. PCA: All Populations in G25 Space
The chart below projects all 43 modern populations and 7 ancient reference samples from this calculator onto their first two principal components, derived from a PCA run on the complete set of G25 scaled coordinates. PC1 (60% of variance) is the dominant axis: it separates the Germanic-Scandinavian pole (right, anchored by Denmark_Jutland_IA) from the Southern European and Hallstatt pole (left, anchored by Italy_Imperial). PC2 (13%) separates Atlantic/Celtic populations (top) from Eastern European populations carrying Slavic drift (bottom, anchored by Poland_Early_Medieval_Slavic).
French regions are split into three groups to highlight a distinction that matters for this calculator: northern Atlantic France (Brittany, Lower Normandy, Pays de la Loire) plots visibly further right and upward than Germanic-influenced northern France (Upper Normandy, Picardy, Nord-Pas-de-Calais, Champagne-Ardenne, Alsace, Lorraine), the latter cluster sitting clearly between the Belgian positions and core French territory, reflecting their partial Germanic overlay from Frankish settlement and their geographic proximity to the Low Countries.
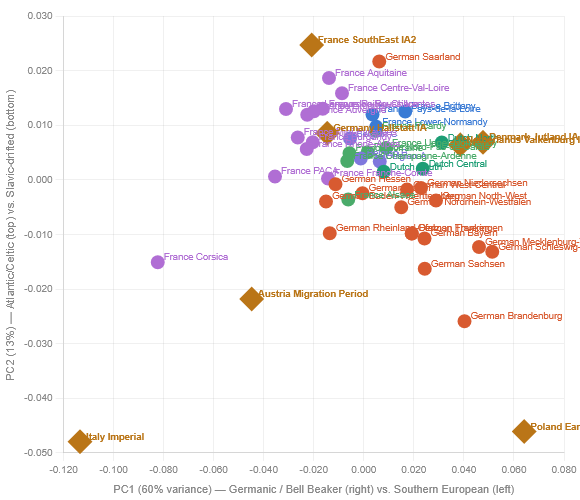
Figure 4: PCA of all 43 modern populations and 7 ancient references included in this calculator. Computed from G25 scaled coordinates. PC1 (60% variance) runs from Germanic/Bell Beaker (right) to Southern European (left). PC2 (13%) separates Atlantic/Celtic (top) from Slavic-drifted eastern populations (bottom). Hover over any point to see its name.
Several patterns stand out clearly. Dutch North plots almost as far right as the ancient Valkenburg_IA reference, confirming its strong Bell Beaker / proto-Germanic substrate. Brittany, despite being geographically in France, positions clearly to the right and above the Germanic-influenced French group (Upper Normandy, Picardy, Alsace), reflecting its preservation of Atlantic Bell Beaker ancestry with minimal Frankish admixture. The Germanic-influenced northeastern French regions (Alsace, Lorraine, Champagne-Ardenne) cluster between Belgian and core French interior positions, consistent with their documented Frankish and Alemannic settlement history. Finally, Corsica is the most extreme outlier in the entire dataset, sitting far left on PC1 and below the main French cluster, close to Italy_Imperial, a direct confirmation of its Mediterranean, non-Bell Beaker genetic character.
6. Patterns Across Central-Western European Populations
The G25 coordinate data available for the populations in this calculator reveal several coherent geographic and historical patterns worth understanding before you run your own results.
| Population | Expected dominant source | Secondary source | Historical interpretation |
|---|---|---|---|
| Dutch North & Central | Netherlands_Valkenburg_IA | Denmark_Jutland_IA | Core Bell Beaker territory; moderate Germanic via Frankish/Frisian settlement |
| Dutch South | Netherlands_Valkenburg_IA | Germany_Hallstatt_IronAge | Belgic Gaul influence; slightly more Hallstatt Celtic heritage |
| German North-West | Denmark_Jutland_IA | Netherlands_Valkenburg_IA | Old Saxon territory; transitional between Bell Beaker and Germanic |
| German North (Schleswig-Holstein, Mecklenburg) | Denmark_Jutland_IA | Poland_EarlyMedieval_Slavic (minimal) | Core Germanic North Sea/Baltic zone; closest to Danish Iron Age source |
| German South (Bayern, Baden-W.) | Germany_Hallstatt_IronAge | Denmark_Jutland_IA | Hallstatt Celtic heartland; later Germanic settlement; some Roman provincial |
| Belgian (A/B/C) | Netherlands_Valkenburg_IA | Germany_Hallstatt_IronAge | Belgic tribes mixed Bell Beaker and Hallstatt Celtic; Frankish Germanic overlay |
| France North, Atlantic (Brittany, Lower Normandy, Pays de la Loire) | Netherlands_Valkenburg_IA | Germany_Hallstatt_IronAge | Strongest Bell Beaker signal of all modern populations; Atlantic Celtic heritage largely intact; minimal Frankish overlay; minor Viking Norse in Lower Normandy |
| France North, Germanic-influenced (Upper Normandy, Picardy, Nord-Pas-de-Calais, Champagne-Ardenne, Alsace, Lorraine) | Netherlands_Valkenburg_IA + Denmark_Jutland_IA | Germany_Hallstatt_IronAge | Intermediate between Belgian and Atlantic France; elevated Germanic signal from Frankish settlement (Neustria), Saxon/Norman influx in Upper Normandy, and Alemannic presence in Alsace-Lorraine; plots closer to Belgians than to Brittany in G25 space |
| France South-East (PACA, Rhone-Alpes) | Germany_Hallstatt_IronAge / France_SouthEast_IA2 | Italy_Imperial | Gaulish Celtic + Roman provincial; Greek colonial influence (Massalia/Marseille) |
| France Corsica | Italy_Imperial | France_SouthEast_IA2 | Strongly Mediterranean; closest to Italian ancestral profile; outlier within France |
| German Sachsen / Brandenburg | Denmark_Jutland_IA | Poland_EarlyMedieval_Slavic | Historically Slavic-settled east; Germanized from medieval period; detectable Slavic substrate |
Table 1: Expected dominant and secondary source contributions for key Central-Western European populations, based on their G25 coordinates and historical background. Note that these are interpretive expectations; individual results may vary.
7. How to Use the Calculator
Using the Central-Western Europe Calculator is straightforward if you already have your G25 coordinates. Here is a step-by-step guide.
- Obtain your G25 coordinates. If you have tested with 23andMe, AncestryDNA, or MyHeritage, you can generate G25 coordinates using the tools available on the ExploreYourDNA Calculators page. You need your scaled G25 coordinates (not the unscaled version).
- Open the calculator. Navigate to the Central-Western Europe Calculator by Oliver. The calculator interface runs on Vahaduo, which will open in a linked tab.
- Paste your coordinates into the "target" field. Format:
YourName,PC1,PC2,...,PC25. Click "Run" (single mode for one individual, multi mode for several). - Interpret your results. You will receive a percentage breakdown across the seven source populations listed above. Focus primarily on the Bell Beaker (Valkenburg), Germanic (Jutland IA), and Hallstatt (Hallstatt IA + France SouthEast IA2) signals. Roman (Italy Imperial + Austria Migration Period) will only be significant for populations with genuine Roman-era ancestry.
- Compare against the reference populations below. The G25 coordinates of modern Central-Western European populations provided in Section 7 below can be used as benchmarks: paste them as additional targets to see how your results compare to regional averages.
Try the Calculator Now
Paste your G25 scaled coordinates and explore your Bell Beaker, Germanic, Hallstatt, and Roman ancestry proportions. Free to use, no registration required.
Open the Calculator →8. G25 Coordinates: Central-Western European Reference Populations
Below are the G25 scaled coordinates for a comprehensive set of Dutch, Belgian, German, and French regional populations. These can be used as reference targets in the calculator to compare your own results against population averages, or loaded into Vahaduo for multi-target runs.