23andMe has released its 2025 ancestry update, and overall the results are excellent. In our community, the improvements are clear: more precise regional assignments, better separation of closely related populations, and refinements driven by larger, better-curated reference datasets.
Why Results Change Over Time
Your raw DNA does not change after you test. What changes is the reference panel, the database of people from known populations that your DNA is compared against. As new and richer reference data are added, the algorithm can distinguish, for example, Northern French from Belgian ancestry, or Spanish from Portuguese, with greater confidence. Sometimes this means a region you previously had may shrink, disappear, or be split more finely. That is not your family history changing, it is the lens becoming sharper.
Why Results Can’t Be 100% Exact
- Population overlap: Neighboring regions share centuries of gene flow. Eastern France, western Germany, Belgium, and the southern Netherlands are genetically close.
- Historical migrations: People moved, mixed, and intermarried for millennia; modern borders rarely align with genetic clusters.
- Statistical modeling: Ancestry estimates are probabilistic. A “French” signal may appear as “British” or “German” in another update depending on the strength and structure of reference data.
- Legal and sampling barriers: Some populations are underrepresented. In France, strict laws limit collecting population genetics samples; reference panels may rely on fewer or indirect datasets, which can reduce precision for some French sub-regions.
What’s New in 2025: Finer Distinctions in NW Europe
Despite sampling constraints in certain countries, the 2025 update shows notable progress. German and French ancestries are now properly separated, and even very closely related groups, such as North French, Walloons, Flemish, and South Dutch, are more clearly distinguished than before. A few years ago, this level of granularity would have been unlikely.
Case Studies from Our Community
1) Edge Cases on the French, Belgian Border
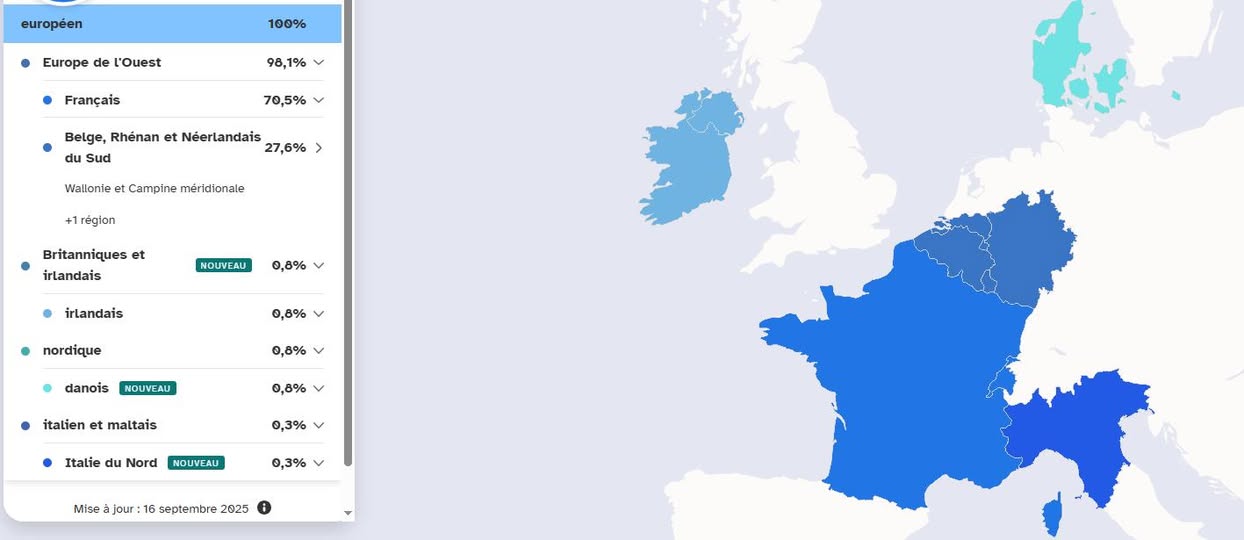
Even with the 2025 gains, some profiles near historical borderlands can be over-pulled into neighboring labels. For example, a tester who is ¾ Belgian and ¼ North French may appear as mostly French with a smaller Belgian/Rhenan/Southern Dutch share. This reflects reference density and deep shared ancestry across the FR, BE, NL corridor more than a contradiction of family history.
2) Nearly 100% English (East Anglia)
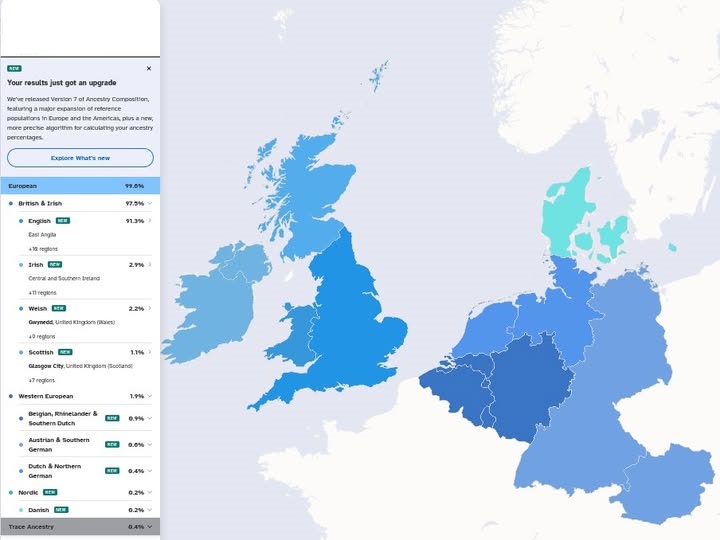
When reference coverage is dense and distinctive, results can become very “clean.” One member with deep roots in East Anglia now shows ~97% British & Irish, including ~91.3% English (East Anglia). Only tiny traces remain from continental Europe (e.g., Belgian/Rhenan/Southern Dutch ~1.1%, German/Northern European ~0.6%). This is a good example of the model’s precision where sampling is strong.
3) Strong Resolution for a Complex American Ancestry
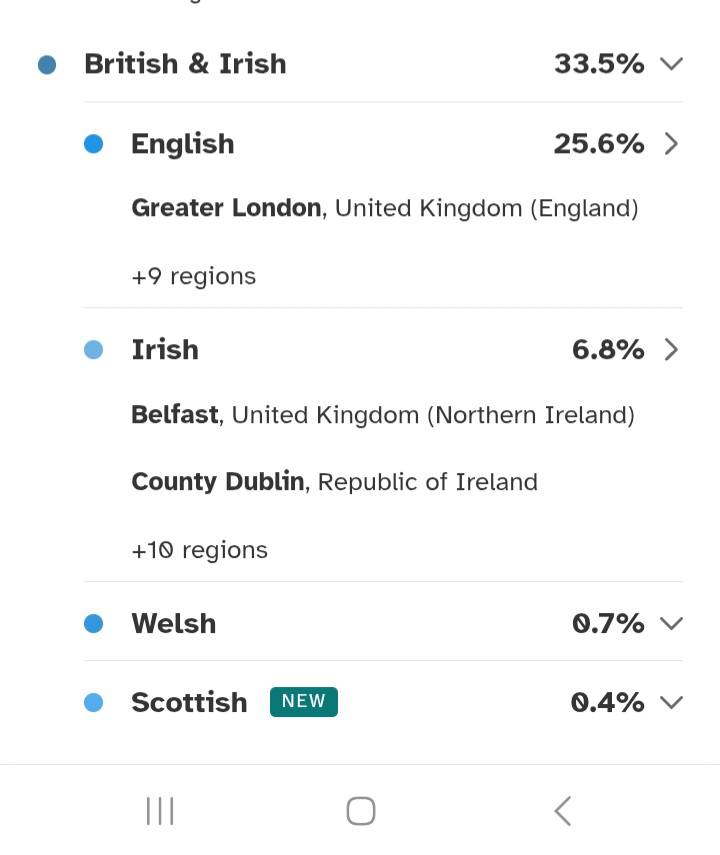
The 2025 update also performs well for mixed diaspora profiles. One US-based tester with British, German, South Italian, Slovenian, Swiss, and West African roots receives a nuanced breakdown with sub-regional anchors:
- British & Irish 33.5%, English 25.6% (Greater London +9 regions), Irish 6.8% (Belfast; County Dublin +10 regions), Welsh 0.7%, Scottish 0.4% (new).
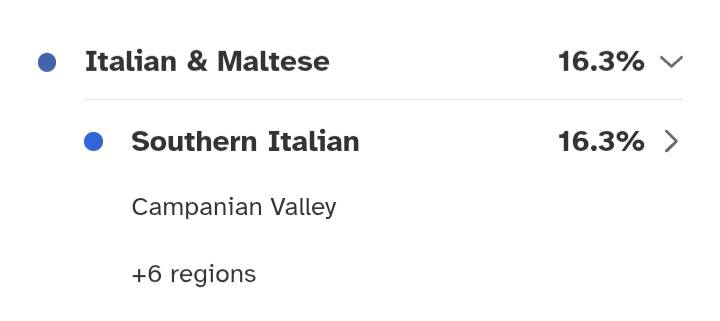
- Italian & Maltese 16.3%, Southern Italian 16.3% (Campanian Valley +6 regions).
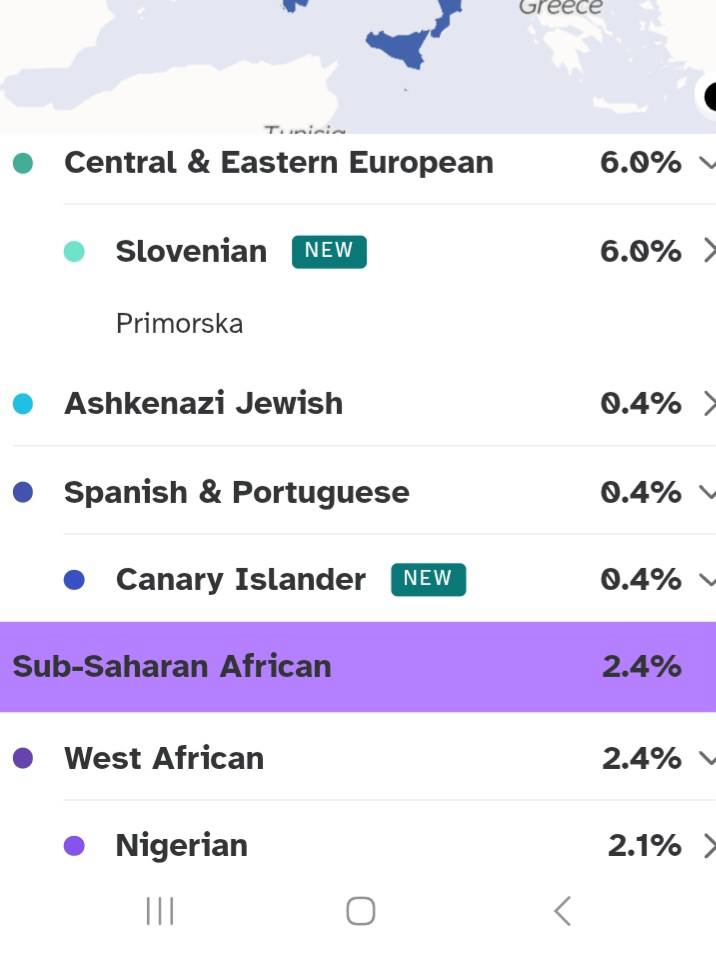
- Central & Eastern European 6.0%, Slovenian 6.0% (new), Primorska.
- Sub-Saharan African 2.4%, West African 2.4%, including Nigerian 2.1%.
- Additional traces: Ashkenazi Jewish 0.4%; Spanish & Portuguese 0.4% including Canary Islander (new) 0.4%.
Even in a multi-origin family tree, the model now provides meaningful substructure with geographic references (e.g., Greater London, Belfast, County Dublin, Campanian Valley, Primorska).
4) A Mostly French Profile with Ashkenazi Polish Roots
Another interesting case is Sylvia, whose family background is approximately ¾ French (half from Dordogne and a quarter from the Loire Valley) and ¼ Ashkenazi Jewish with origins in Poland. Her results clearly reflect this dual heritage.
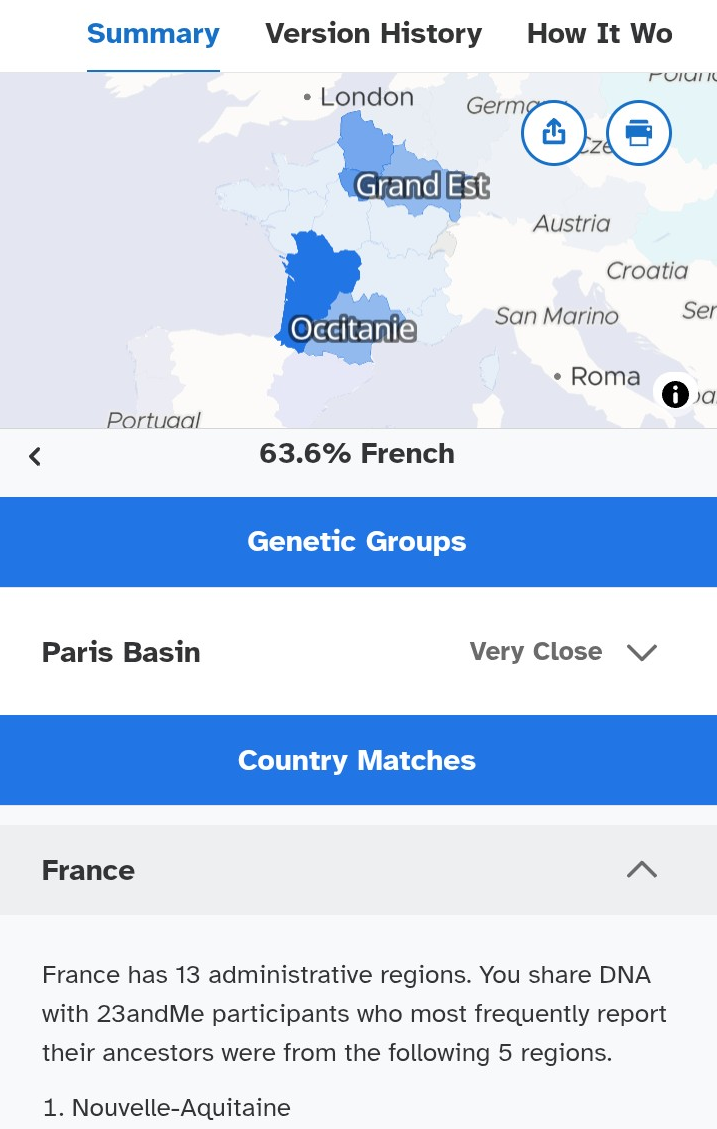
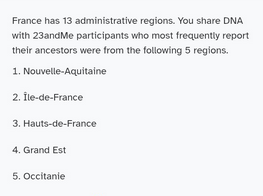
The French component reaches 63.6%, centered on the Paris Basin and overlapping regions such as Nouvelle-Aquitaine, Grand Est, Hauts-de-France, and Occitanie. This distribution aligns remarkably well with her known French family history from western and central France.
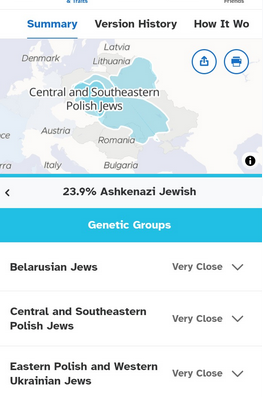
The Ashkenazi component represents roughly 24% of her ancestry and is assigned to Central and Southeastern Polish Jews, with strong affinities also to Belarusian and Western Ukrainian Jewish groups. This reflects the migration history of Polish and Galician Jewish families who settled in France during the 19th and early 20th centuries.
Together, these results illustrate how the 2025 update successfully separates French regional ancestry from the Ashkenazi component, two populations that are historically distinct but have been intertwined in France for over a century. It also demonstrates 23andMe’s ability to capture both continental and diasporic ancestries in a single individual with high precision.
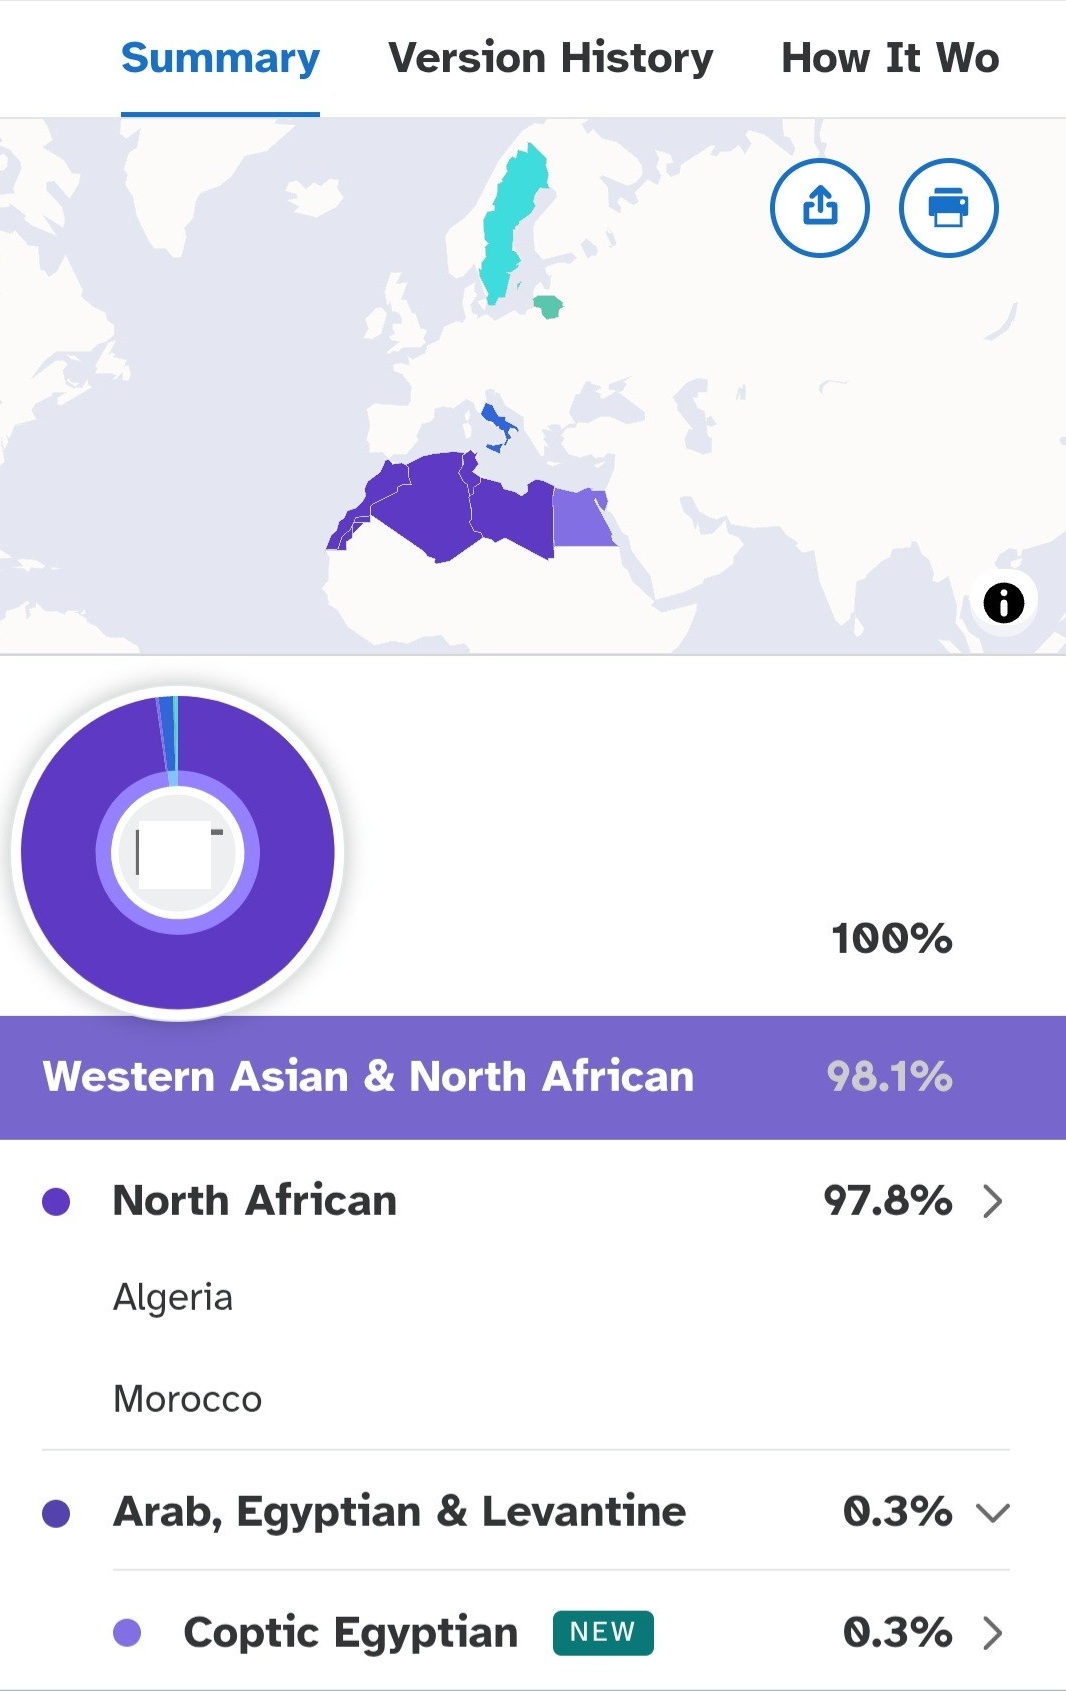
5) A North African Profile (Algeria)
The update also provides excellent resolution for North African testers. One member with deep roots in Algeria shows ~98% North African ancestry, mainly assigned to Algeria and Morocco, with a small but notable Coptic Egyptian component. This demonstrates the ability of the new model to capture diversity within the Maghreb while detecting more specific minority ancestries.
Why 23andMe Remains One of the Most Accurate
While no company can deliver a perfect ancestry breakdown, 23andMe is still considered one of the most accurate in the industry when it comes to ethnicity reports. The reasons are clear:
- It has one of the largest global reference panels, covering tens of thousands of individuals from carefully curated populations.
- It does not rely on a simple admixture algorithm. Instead of only comparing allele frequencies, 23andMe uses a complex model that incorporates haplotype structure, the long segments of DNA inherited together. This allows it to detect finer distinctions between neighboring populations.
- Results are also refined using shared DNA segments with genetic matches, which helps anchor your ancestry to real population clusters rather than only statistical averages.
- The platform benefits from a huge customer base, which allows faster refinement and testing of regional distinctions.
Other companies may offer similar services, but the scale and consistency of 23andMe’s data make it stand out. Importantly, precision is very strong both for people with homogeneous ancestry and for those with more complex family histories. In less mixed cases, the algorithm often produces very clean, stable results that align closely with documented genealogy. In more complex cases, it still provides meaningful substructure and regional detail, thanks to its use of haplotypes and segment-level comparisons.
How It Compares to Other Companies
AncestryDNA also provides detailed regional breakdowns, but its method is closer to a classic admixture approach, primarily comparing allele frequencies against reference panels. It benefits from a large customer base in the US, which improves American regional results, but its European substructure is often less precise.
MyHeritage has improved in recent years, offering attractive maps and a growing reference database. However, it generally remains less fine-grained than 23andMe, especially for distinguishing neighboring European populations.
By combining haplotypes, shared DNA segments, and powerful reference data, 23andMe currently delivers some of the most reliable ethnicity estimates on the market.
How to Interpret Your New Results
Think of ancestry results as a best-fit estimate given current data and methods. Use them as a starting point, not a verdict. Combine your DNA insights with family records, historical context, and geography. Expect refinements: as reference panels grow and algorithms improve, your breakdown may be updated again.
Takeaway
The 23andMe 2025 update is a meaningful step forward. Most users will see results that are more accurate and more informative. At the same time, no DNA company can offer perfect, immutable percentages. Genetics is a science of probabilities shaped by deep history, there will always be overlaps, gray areas, and surprises. Still, 23andMe remains one of the most reliable companies for ethnicity reports, setting the standard for consumer DNA testing.